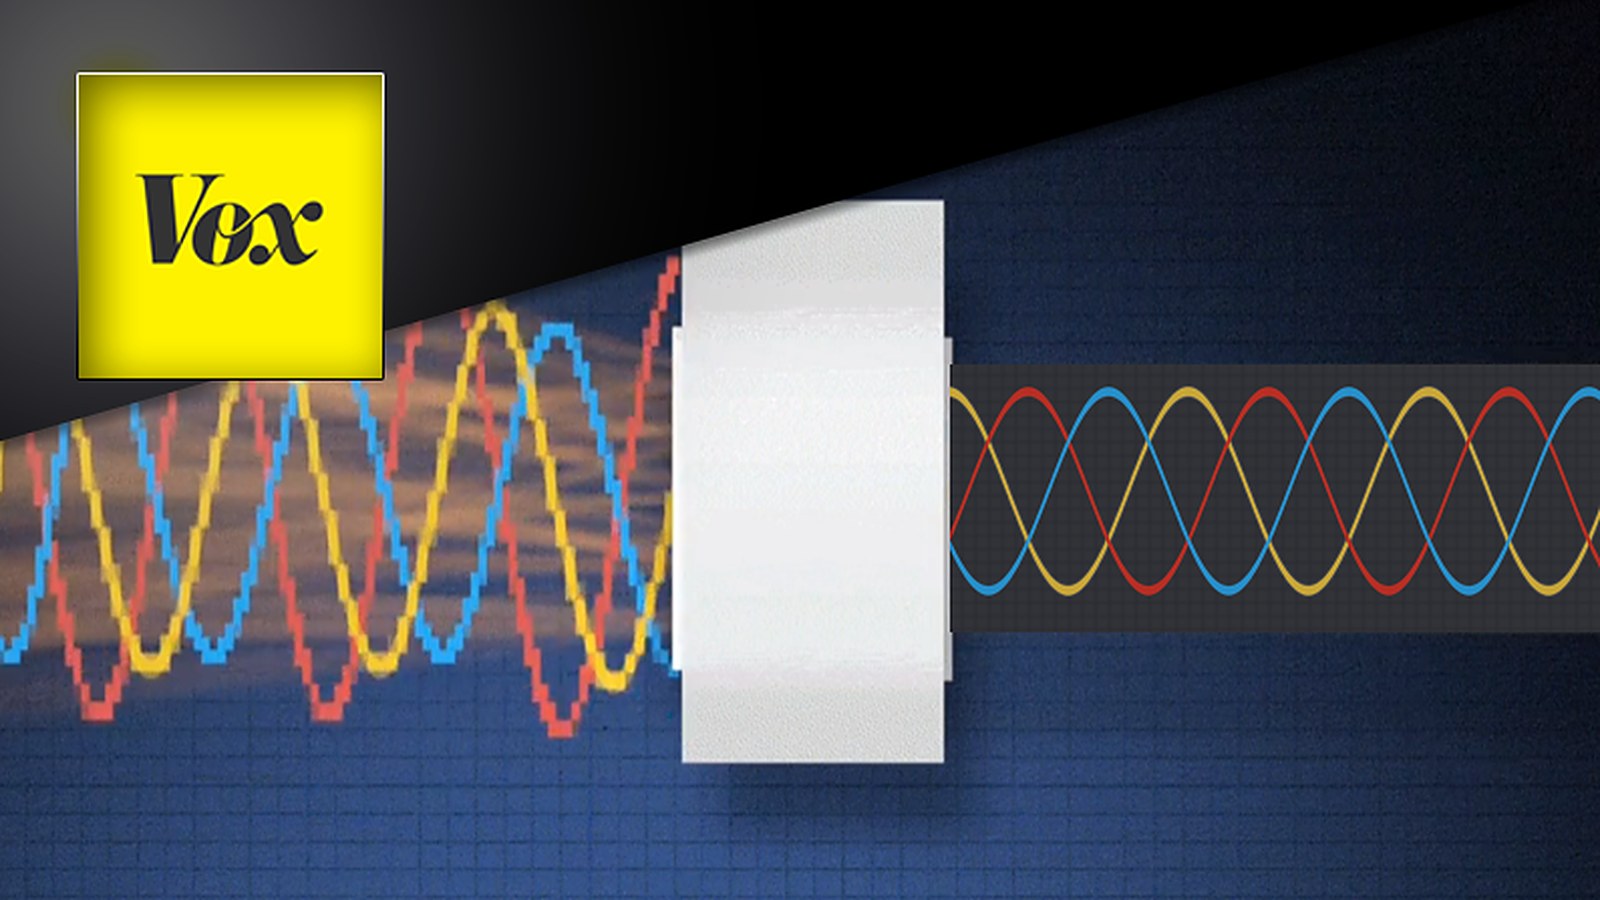

A standard power meter reports RMS averages every second or three. A voltage sag lasts a few cycles. A switching transient lasts microseconds. The meter reports that nothing happened, and the breaker on the floor disagrees.
This is why so many electrical problems present as mysteries: the instrument that should explain the trip cannot see events shorter than its averaging window. The evidence is real, but it lives between the samples.
Measurement at sub-cycle speed changes the conversation. When every waveform is captured, an event has a time, a shape and a cause. Diagnosis replaces folklore, and correction can be verified instead of assumed.
How the measurement works is on the Technology page. What the events do to equipment is on the harmonics damage page.
What an averaged reading can and cannot show
Root mean square (RMS) reduces a changing waveform to one effective value over a measurement window. That value is useful for ratings and monitoring. A summary of that kind cannot show each change as it happens. The Technology page builds its method on the changing waveform instead.
A Class A power quality meter computes magnitudes over 10 or 12 cycles, about 200 milliseconds, and detects dips at half-cycle resolution. It flags any interval that holds a dip. The Voltage Stability page pairs each sag with the current at that moment.
Utility reliability counts miss the same event. IEEE 1366 defines one set of indices for sustained outages and another for momentary ones. The Resilience page gives the case: a two-cycle sag that drops a production line for 51 minutes appears in no SAIDI figure. By the utility’s definition, the supply stayed up.
What the measurement looks like
Log a week at the main switchboard. Capture real power, apparent power, current distortion and neutral current together, as events rather than averages. That record shows which problem the site has. It is also the baseline for any honest before-and-after. The SDE Summary page recommends that a third party collect the baseline before anything is installed.
Where this stands today
The Harmonics page states it briefly: a panel meter is for information, not for analysis. Our controller keeps its own record. It measures the full waveform of the loads it corrects and logs each correction at the panel, as the Data Centers and Compute page describes.
The same page states a limit: the controller does not hold the voltage the source delivers. On the site analysis form, an engineer reads the facts and replies with what we would measure first.
Related reading
- Standards Compliance: the window, the percentile and the place behind each limit
- Electric Optimization: current that heats conductors and fills transformers without doing work