
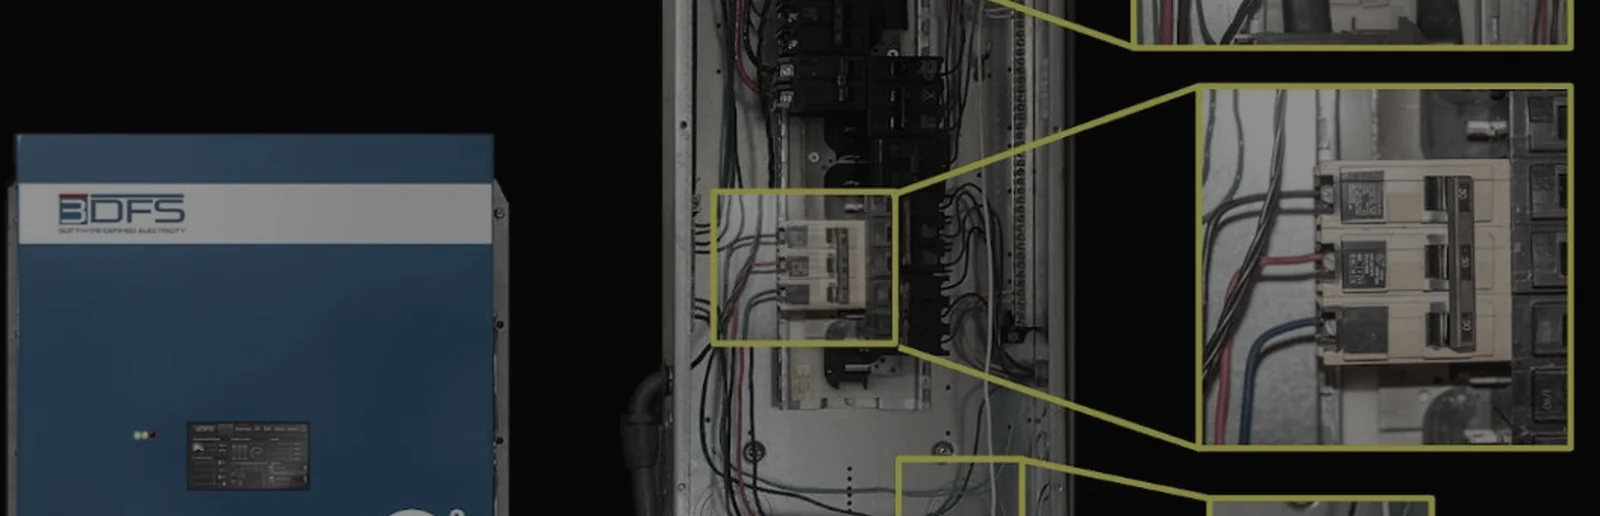
A building meter averages the waveform over seconds and misses the reactive, harmonic and unbalanced current inside one cycle. That current heats wire, does no work and turns into bad voltage on a weak source. We correct the current at the panel, each cycle.
A panel meter reads 480 volts and 300 amperes. Both figures are true. Neither is the whole picture, because each is an average taken over a window long enough to hide the events that matter.
Between two readings, a drive draws its current in pulses. One phase carries more than the others. A fault two substations away pulls the voltage down for six cycles. A transient comes and goes in microseconds.
The display shows none of these events, only the average that contains them. So when a drive faults or a transformer runs hot, the failure reads as bad luck.
A 2001 survey by the Electric Power Research Institute (EPRI) covered 985 U.S. establishments 8. It found that digital economy and industrial firms lose $6.7 billion a year to power quality problems 8. The same study extrapolated the national cost to between $15 billion and $24 billion a year 8. The cost arrives one site at a time, on the utility bill and in the repair budget.
What the meter cannot show
One distorted current shows up in four places. The controller samples over 1,000 times per sine wave and responds in under 5 microseconds 4.
- Utility bill. Sites billed on kVA demand. At 0.80 power factor the service carries 25% more current than the job needs, and the site pays for that share every month 1.
- Drives and servers. Rectifiers that draw current in pulses. An independent third party reported current distortion at a 208 V panel falling from 26, 21 and 27% to 5.5, 6.3 and 5.2% 7.
- Phase balance. Unequal loads on the three legs. In a server rack assessment, the per-phase spread ran 50% above the mean uncorrected and within 1.6% of it corrected 5.
- Generators. Sites behind a weak source. A generator has up to about four times the impedance of a utility transformer, so the same distorted current makes more voltage distortion on it 2.
Four quantities describe most of what goes wrong. The first three are parts of one distorted current, so they arrive together, and reading one without the other two gives the wrong answer. The fourth describes the supply that current flows into.
- Power factor. How much of the power the supply delivers does useful work. A low value means part of the current moves back and forth between the source and the load without producing any.
- Harmonic distortion. Current at multiples of 60 Hz. Each rectifier in the building draws it in pulses. It heats the wire and the transformer without doing work.
- Phase imbalance. Unequal loading between the three legs. It shows up as current in the neutral and as heat in motor rotors.
- Source impedance. How weak the supply is. A weak supply turns the same distorted current into more distorted voltage.
The mix of these three currents changes each time a load switches on or off, so a correction that was right a second ago is wrong now. The correction has to run every cycle.
What Software-Defined Electricity does
Most power quality equipment waits for a voltage symptom: a capacitor bank switches in seconds and an active filter answers in milliseconds 4. Software-Defined Electricity is a computer at the panel. It measures the current waveform itself and corrects it digitally, within the same cycle. Sub-cycle means inside one 60 Hz cycle, 16.7 milliseconds 4. It installs in parallel at the distribution panel, through its own breaker: it connects alongside the loads and does not carry their supply current. Measure, model, correct, every cycle.
It samples three-phase voltage and current continuously. It separates the working current from the reactive, harmonic and unbalanced parts. It works out the ideal current for that instant and supplies the non-working parts from the panel, at the moment the loads need them. It corrects harmonics through the 23rd order 4.
The loads keep drawing what they draw. What changes is where the non-working current comes from: the controller at the panel, so the feeder and the transformer from the panel back to the utility carry less, within the controller’s rating 4. Reactive current is not waste. Without it a motor has no magnetic field and makes no torque 9. The motor keeps getting it, from the panel instead of the utility. Two models are in production, the VectorQ2 for 208 V networks and the VectorQ5 for 480 V, rated 50 and 60 A per phase 4.
The next figures are measured, not modeled. Three words carry them: real power is the part that does work, reactive power is the part that moves back and forth, and apparent power is the total the supply has to carry. We instrumented a refrigerated container. One like-for-like row pair reads power factor 0.82 to 1.00, reactive power 4,827 to 471 var and apparent power 8,339 to 7,229 VA 6.
An independent third party reported a test at a 208 V panel, measured on a power quality analyzer. The neutral fell from 15.6 amperes to 2 7. We will send the capture and the method on request. We would rather somebody independent read it than have anyone take our word.
How the industry got here
Each of these problems was solved once, correctly, for a load that no longer exists. Capacitor banks answered the lagging motor load of the mid-twentieth century, and answered it well. Then solid-state drives arrived, and the load stopped being linear. Capacitors met a distortion they were never designed for. Sometimes they amplified it through resonance.
Harmonics got their own stack: line reactors, tuned passive filters, then active filters that measure and inject. Imbalance was managed by design discipline. Once buildings began to change faster than their panel schedules, upsized neutrals and derated motors took over.
Each of those measures is a device applied at one point and sized against a load study taken before installation. The buildings underneath them now add and remove electronic load continuously. So the study ages faster than the equipment.
Measurement did not keep pace either. Compliance instruments average over intervals long enough to make a limit enforceable. The same intervals make short events invisible.
Where it matters
The same three current problems appear in any facility. What differs is which one costs most, and how weak the source behind the panel is. They arrive from three directions, which this site calls the three Opportunity Pillars.
- Consumption: pulsed loads distort the current inside the facility.
- Delivery: feeders built for one direction now carry power both ways.
- Generation: an inverter has no spinning mass to absorb the first instant of a motor start or a fault.
Each sector page carries its own measured rows.
Read more: Industrial and Manufacturing, Water and Wastewater, Data Centers and Compute, Defense and Critical Infrastructure, Maritime, Microgrids and Storage and Grid Blackstart.
Where to start
Start with measurement, not a purchase. The symptom is a drive that faults or a transformer that runs hot every few months, with nobody naming the cause. Log a week at the main switchboard. Capture real power, apparent power, current distortion and neutral current together, as events rather than averages. That record shows which of the three current problems the site has, and a known current step at the bus measures the fourth.
The same record is the baseline for any honest before-and-after. To say what correction would save, we need a week of the site’s data, not an estimate.
Read more: the PQ Component pages, Power Factor, Harmonics, Phase Balance and Voltage Stability, one page per fault.
Then ask any vendor, us included, the same questions. Ask where the correction is applied. Ask how fast it responds, relative to how fast the load changes. Ask whether the number in the proposal is a measurement or a model, and who took it. We recommend that a third party collect the baseline before anything is installed.
Start by measuring the building before anyone sells a box for it.
Frequently asked questions
What is software-defined electricity?
Software-Defined Electricity is a computer at the panel that measures the current waveform and corrects it digitally within the same cycle 4. It installs in parallel at the panel through its own breaker, outside the supply current 4. It separates the working current from the reactive, harmonic and unbalanced parts and supplies those parts itself, within its rating, through the 23rd harmonic, in under 5 microseconds 4. Two 3DFS models are in production, for 208 and 480 V networks 4.
What is sub-cycle power correction?
Correction inside one 60 Hz cycle, 16.7 milliseconds, rather than seconds after a symptom appears. Software-Defined Electricity corrects the current within the same cycle 4. Most equipment waits for a voltage symptom: a capacitor bank switches in seconds, an active filter in milliseconds 4. The mix of non-working current changes each time a load switches, so correction has to run every cycle. The controller samples over 1,000 times per sine wave and corrects in under 5 microseconds 4.
What does a panel meter miss?
The events inside its averaging window. A panel meter reading 480 volts and 300 amperes is true, and each figure is an average. Between readings a drive draws current in pulses, one phase carries more than the others, and a fault pulls the voltage down for six cycles. A Class A instrument aggregates to 3 seconds and 10 minutes, and flags a dip on half-cycle values, so it records the event but not the current behind it 3.
Where should a facility start?
With a week of measurement at the main switchboard, not a purchase. Capture real power, apparent power, current distortion and neutral current together, as events rather than averages. That record shows which of the three current problems the site has, and a known current step at the bus measures the fourth. Then ask any vendor, 3DFS included, where the correction is applied, how fast it responds, and whether the number in the proposal is a measurement or a model.
Sources
- MIT OCW 6.622, Lecture 4 (Perreault), p. 2: power factor as average power over V_rms × I_rms. 1 / 0.80 = 1.25.
- The Green Grid, White Paper 55, Table 3, p. 15: typical source impedance by supply type.
- IEC 61000-4-30:2025, clauses 4.4, 4.5 and 5.4.2. IEEE 519-2022, clause 5.
- 3DFS, VectorQ Technical Overview (current revision), Technical Specifications table. First-party.
- 3DFS, electrical network analysis of server racks at a data center, p. 25. First-party.
- 3DFS, refrigerated container bench test, row 4d. First-party.
- Independent third-party verification report, SDE Technology Verification Testing, p. 13. Facilitated by an independent third party with 3DFS.
- EPRI (Primen for CEIDS), The Cost of Power Disturbances to Industrial and Digital Economy Companies (2001-06), product 3002000476, ES-3 and p. 4-5. https://restservice.epri.com/publicdownload/000000003002000476/0/Product
- Ingarra, N. Understanding the Thermodynamics of Alternating Current. In Compliance Magazine, 2026-10-30. Discussion of reactive current’s role in motor magnetic fields. https://incompliancemag.com/understanding-the-thermodynamics-of-alternating-current/
Version 5.3