
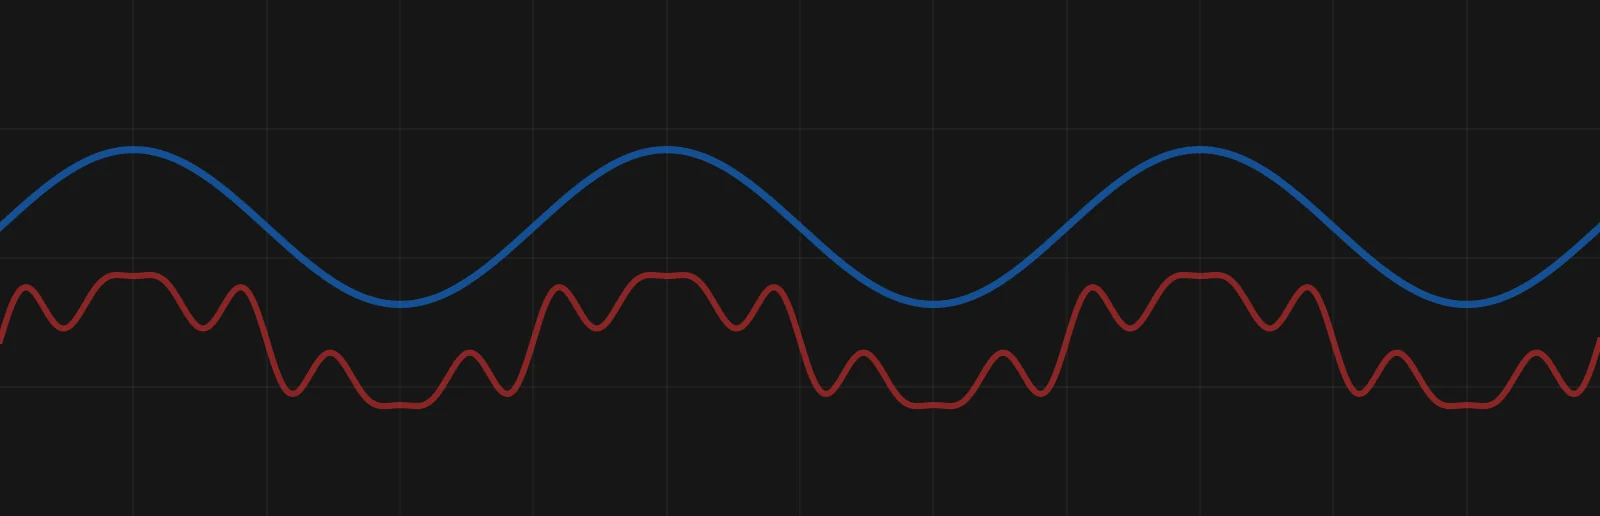
Electric optimization reduces the extra current a supply path has to carry. Power Quality Rating, PQR, brings the electrical conditions behind that current into one score. Software-Defined Electricity improves those conditions at the panel, so more of the existing supply capacity can serve the load.
A transformer can reach its carrying limit before its loads receive all the useful power its rating might suggest 3. Start by understanding what occupies that capacity. PQR brings power factor and waveform distortion into one rating 1.
Two words recur on this page. Upstream means the supply side of the panel: the feeder, the transformer and the utility behind them. Non-working current is the extra current the supply carries beyond what the loads need for useful power.
What optimization is
Improve the electricity before adding more infrastructure. The rating is not a current reading. It summarizes the conditions that put non-working current on the supply, so when those conditions improve, the rating rises and the upstream current can fall 1,3.
- Less heat. Reduce the work imposed on the supply path. Lower current means lower conductor losses when resistance stays the same 3.
- Available capacity. Make room in the equipment already installed. Reducing non-working current can release upstream carrying capacity 3.
- Applicable charges. Correct what the tariff counts. Active power is the useful power. Apparent power is the demand that occupies supply capacity, and lower apparent demand can reduce charges where the utility bills kVA 3.
PQR is our summary rating of electrical conditions on a 0 to 100 scale. Higher is better 1. It connects measurements often discussed separately.
- Power factor. Reactive demand lowers the displacement power factor used in the white-paper calculation 1.
- Harmonics. Distortion in current and voltage lowers the score 1.
- Phase loading. Our simulator also reduces its displayed score when phase currents are unequal 2.
There are two versions of the calculation, and this page keeps them apart. The white paper’s score uses power factor, current distortion and voltage distortion. Voltage level does not enter it. The simulator on this site uses the same three and then adjusts the result for phase balance 1,2.
Improve the conditions at the panel, then measure what the supply carries afterwards. The result can be less current, less upstream heat or more room for useful load 3. Measure each result separately.
The formula, worked through
The white paper scores each phase, L1, L2 and L3, and averages the three 1.
PQR = 100 × (L1 + L2 + L3) ÷ 3, where each phase term is cos φ ÷ (√(1 + THDi²) × √(1 + THDv²)).
Here cos φ is the displacement power factor. THDi and THDv are the current and voltage total harmonic distortion written as fractions, so 30% is 0.30. Each phase term comes out between 0 and 1, and the factor of 100 puts the average on the white paper’s 0 to 100 scale 1.
An illustration, not a measurement. The three phases are alike here, so the average equals one phase term.
- Before correction. Power factor 0.85, current distortion 30%, voltage distortion 3%. √(1 + 0.30²) = 1.0440 and √(1 + 0.03²) = 1.0005. 0.85 ÷ (1.0440 × 1.0005) = 0.8138, a score of 81.4.
- After correction. Power factor 0.99, current distortion 5%, voltage distortion 2%. √(1 + 0.05²) = 1.0012 and √(1 + 0.02²) = 1.0002. 0.99 ÷ (1.0012 × 1.0002) = 0.9886, a score of 98.9.
In this example, power factor lowers the score most and voltage distortion lowers it least. That order can change with other inputs. Our simulator also multiplies the average by a phase-balance factor. Take the highest phase current minus the lowest, divide by the average of the three phase currents, and subtract that fraction from 1. Equal phases give a factor of 1, and unequal phases give less, so they lower its score 2.
What it costs
Poor power factor makes the supply path carry more current for the same active load, and that extra current occupies feeder and transformer capacity and adds conductor heat 3. Capacity can become a problem before the bill makes it obvious.
Hold the active load, voltage and conductor resistance unchanged. At 0.85 power factor, the supply carries about 18% more current than at unity power factor. Its conductor losses are about 38% higher than in the unity-power-factor case 3.
That 38% applies to conductor losses, not the site’s total electricity use. A rating improvement does not translate directly into the same percentage of bill savings 1,3.
The cost appears as electricity lost to heat, occupied supply capacity and any charges for apparent demand 3. One site cares most about an expansion that would otherwise need a larger feeder. Another has spare capacity but a tariff that rewards correction. PQR shows where to look. Current, operating hours, the supply path and the tariff set what the condition costs 1,3.
What a better score means for efficiency
Higher power factor and lower current distortion mean less current for the same useful power 3,5. Conductor losses follow the square of that current, I²R 3. Compare two currents whose 60 Hz part is the same size. The one that also carries 30% distortion produces about 9% more I²R heating than the clean one 5.
This calculation uses the before and after conditions of the score example above. Hold active power, voltage and conductor resistance fixed. Current then scales with √(1 + THDi²) ÷ cos φ. That is 1.0440 ÷ 0.85 = 1.228 before and 1.0012 ÷ 0.99 = 1.011 after. This is our own calculation from the cited relationships 3,5. Current falls to 0.823 of its starting value and conductor losses to 0.823² = 0.68.
The U.S. Department of Energy gives a worked example for one motor. Raising its power factor from 0.85 to 0.95 cuts losses in the conductor serving that motor by 19.9%. DOE puts those losses near 2% of the energy on that conductor. The saving is then about 0.4% of that energy 3. In that example the conductor losses are a small share of the energy, so a large percentage cut in them is a small saving in energy.
The controller uses power too. The 2016 rack report lists 31.86 W for it in the second assessment 4. A net saving subtracts that draw. A higher score is not a percentage of energy saved 3.
How the industry has dealt with it
Make the supply path larger, or reduce what it has to carry 3. A larger transformer or feeder provides more room. Power-factor correction can release capacity in the equipment already installed 3.
Capacitors supply reactive power locally to improve displacement power factor, and harmonic filters address waveform distortion. Their functions can overlap, so the specification must follow the conditions at the panel 3,6. PQR follows the combined result: one component can improve while another still limits the score 1.
How Software-Defined Electricity handles it
The controller connects in parallel with the loads, measures at the incoming conductors and supplies the reactive and distorted current locally, so less of it travels upstream 5. The loads still draw the power they need for their work. What changes is what the feeder and transformer carry 5.
As displacement power factor improves and distortion falls, the corresponding PQR terms improve 1. In the simulator, improving phase balance also improves the displayed score 2. The rating follows that electrical change.
For example, our second server-rack assessment recorded power factor rising from 0.831 to 0.995. Apparent power fell from 1,898 VA to 1,655 VA and reported total current from 15.86 A to 13.84 A 4. In that same before-and-after reading, the active watts rose. So the reading demonstrates lower current and apparent demand at the connection, not net energy savings 4.
Measure the electrical improvement and its value in the supply path and tariff 3.
Where it matters
An industrial plant can assess headroom before adding equipment. A water plant can compare conditions at a pump or distribution panel. A data center can examine the apparent demand occupying rack capacity.
Read more: Consumption explains the loads. The PQR Simulator shows how conditions change the rating in an educational model. PQRA examines a facility’s recordings.
What to measure
Measure the panel before choosing the hardware. Record the PQR method, power factor, current and voltage distortion, and phase currents 1,2. Keep active energy and apparent demand alongside the rating 3.
Compare the same measurement point under comparable operating conditions. Our source documents and simulator use different score formulations, so the calculation must stay fixed 1,2,5.
Then establish the business result. Net energy savings must include the controller’s consumption. Capacity relief comes from the measured reduction in demand. Bill savings depend on the tariff and billing period 3,4.
A higher rating explains the improvement. A site measurement puts a value on it. Define the scope before quoting equipment or return.
Sources
- 3DFS, *Software-Defined Electricity: Optimized Electrification*, Chapter 1, 2023, p. 12. First-party PQR definition and formula. White paper.
- 3DFS, PQR Simulator and method notes. First-party educational model with a phase-balance adjustment.
- U.S. Department of Energy, *Continuous Energy Improvement in Motor Driven Systems*, printed pp. 9-2 to 9-6 and 9-9 to 9-11. The 0.85 comparison is calculated from its current and conductor-loss relationships. Source.
- 3DFS, *Electrical Network Analysis*, August 5, 2016, PDF pp. 7, 10 and 29. First-party rack assessment. Report.
- 3DFS, *VectorQ Technical Overview*, R034B, March 2026, PDF pp. 2, 9 to 10 and 12 to 14. First-party operation, connection, measurement and rating description.
- *Power factor correction: A guide for the plant engineer*, September 2024, pp. 3 and 20. Capacitor and filter functions. Source.
Version 6.1