

Server power supplies draw pulsed, unbalanced current. It heats the PDU, loads the neutral and fills the UPS without doing work. We correct that current at the panel in real time, and the panel records each sag. In Uptime Institute’s 2023 survey, 54% of operators said their latest significant outage cost more than 100,000 dollars 43.
Executive summary
Where kVA is the limit, the same rating carries more useful load. Results depend on the facility baseline 31. Verify released capacity and net savings at equal useful output. Software-Defined Electricity (SDE) is not a UPS. It is one layer of ride-through, with the UPS, the batteries and the facility controls 37.
- AI training. High-density racks and synchronized workloads. Correction supplies the reactive and harmonic share of the rack current at the panel. Where the limit is a rating in kilovolt-amperes, that rating then carries more useful load 24,28.
- Inference. Continuous compute with changing request volume. The controller corrects a change in load current in under 5 microseconds, so the correction follows a change in load 29.
- Cooling. Motors, pumps, fans and compressor drives. Correction on the mechanical panel reaches the utility or the generator that feeds it 1,12. The controller’s own losses are listed 29. The net heat balance is not on file.
- UPS and distribution. UPS inputs, PDUs and shared distribution. Correction on a PDU behind the UPS lightens the UPS inverter and the PDU transformer, and the feeder neutral carries near zero for phase-to-neutral loads 1,12,29.
Current that does no work still fills the rating of each PDU, UPS and transformer it crosses 12,24.
A data hall is full of power supplies. Each server, switch and GPU tray draws current through one. A supply holds its output steady across its rated input range. When the voltage dips, it draws more current to keep the same power. More current means a deeper dip across every wire and transformer feeding them.
The grid saw a related failure in July 2026. About 3,800 megawatts of data center load transferred to backup power during a fault the grid cleared in 2 to 3 cycles 7. PJM’s preliminary finding is that the transfer was likely due to voltage ride-through performance 7. Texas now requires large computational loads to ride through sags. FERC has ordered NERC to file national rules by the end of the year 6.
Inside the hall, the same supplies draw current in pulses. The pulses heat transformers, load the UPS and turn into cooling load. AI halls add swings of tens of megawatts, up to three times a second.
This is the Consumption pillar at its densest. Nonlinear loads distort the waveform, and here the load is the building.
Most power quality equipment reacts to a voltage symptom, in seconds, after the event. Software-Defined Electricity works on the current instead. We measure the full waveform at the panel and correct the current waveform digitally, inside the same cycle. The VectorQ controller does this in parallel at the panel.
It corrects the current of the loads on that panel in millionths of a second. The controller logs each correction.
The capacity already installed
The demand. IEA expects global data center electricity use to roughly double by 2030, from 485 terawatt-hours in 2025 to 950 41. One leading GPU maker’s rack-scale system draws about 120 kilowatts 42. Racks of that size land on a feeder, a transformer and, in many designs, a UPS, each with a fixed rating 21.
The supply question. The buildout to 2030 needs new supply 41. The other path is more useful load from the capacity already installed. In a data hall, that capacity is a rating: the kilovolt-amperes of each transformer, UPS and generator 12,24. Where the limit is a contract in megawatts, correction adds little capacity under that limit.
The problem
The load. A data hall is an electronic load on 208Y/120 volt or 415Y/240 volt power distribution units (PDUs) 11,21,39. A double-conversion UPS and a standby generator sit in front of the PDUs 1,21.
Most computer equipment takes 208Y/120 volt power with a grounded neutral 1. In the common North American design, a K-rated transformer in the PDU steps 480 volts down to 208 volts for the racks 11. A 480 volt UPS sits upstream 21.
Each server draws through a switching power supply with power factor correction 12,21. The supply is a nonlinear load. Its current is not proportional to the voltage. The control circuit varies the switch duty cycle to hold the output voltage as the input moves 1.
Signs the electricity in a data hall is uncontrolled
- The PDU transformer runs hot at a load well under its rating, and transformers under 70% of rating have tripped on over-temperature 1.
- The neutral on a 208Y/120 volt PDU carries current the three phases were supposed to cancel 1.
- The UPS input reads clean while the critical bus behind the inverter carries the rack distortion 1.
- The generator runs unstable when the racks land on it through bypass, above roughly 20% leading reactive current 14.
- A fault the utility cleared in cycles puts the whole hall on backup, because a facility scheme counted three sags in one minute 8.
- The meter on the rack power strip reads the current as much as 50% low, and the power usage effectiveness (PUE) arithmetic inherits the error 1,12.
- The capacitor bank on the mechanical side resonates at a harmonic frequency, and the resonance moves when the generator takes the bus 1,12.
- The cooling plant carries the heat the harmonics made in the transformer, the PDU and the UPS 12.
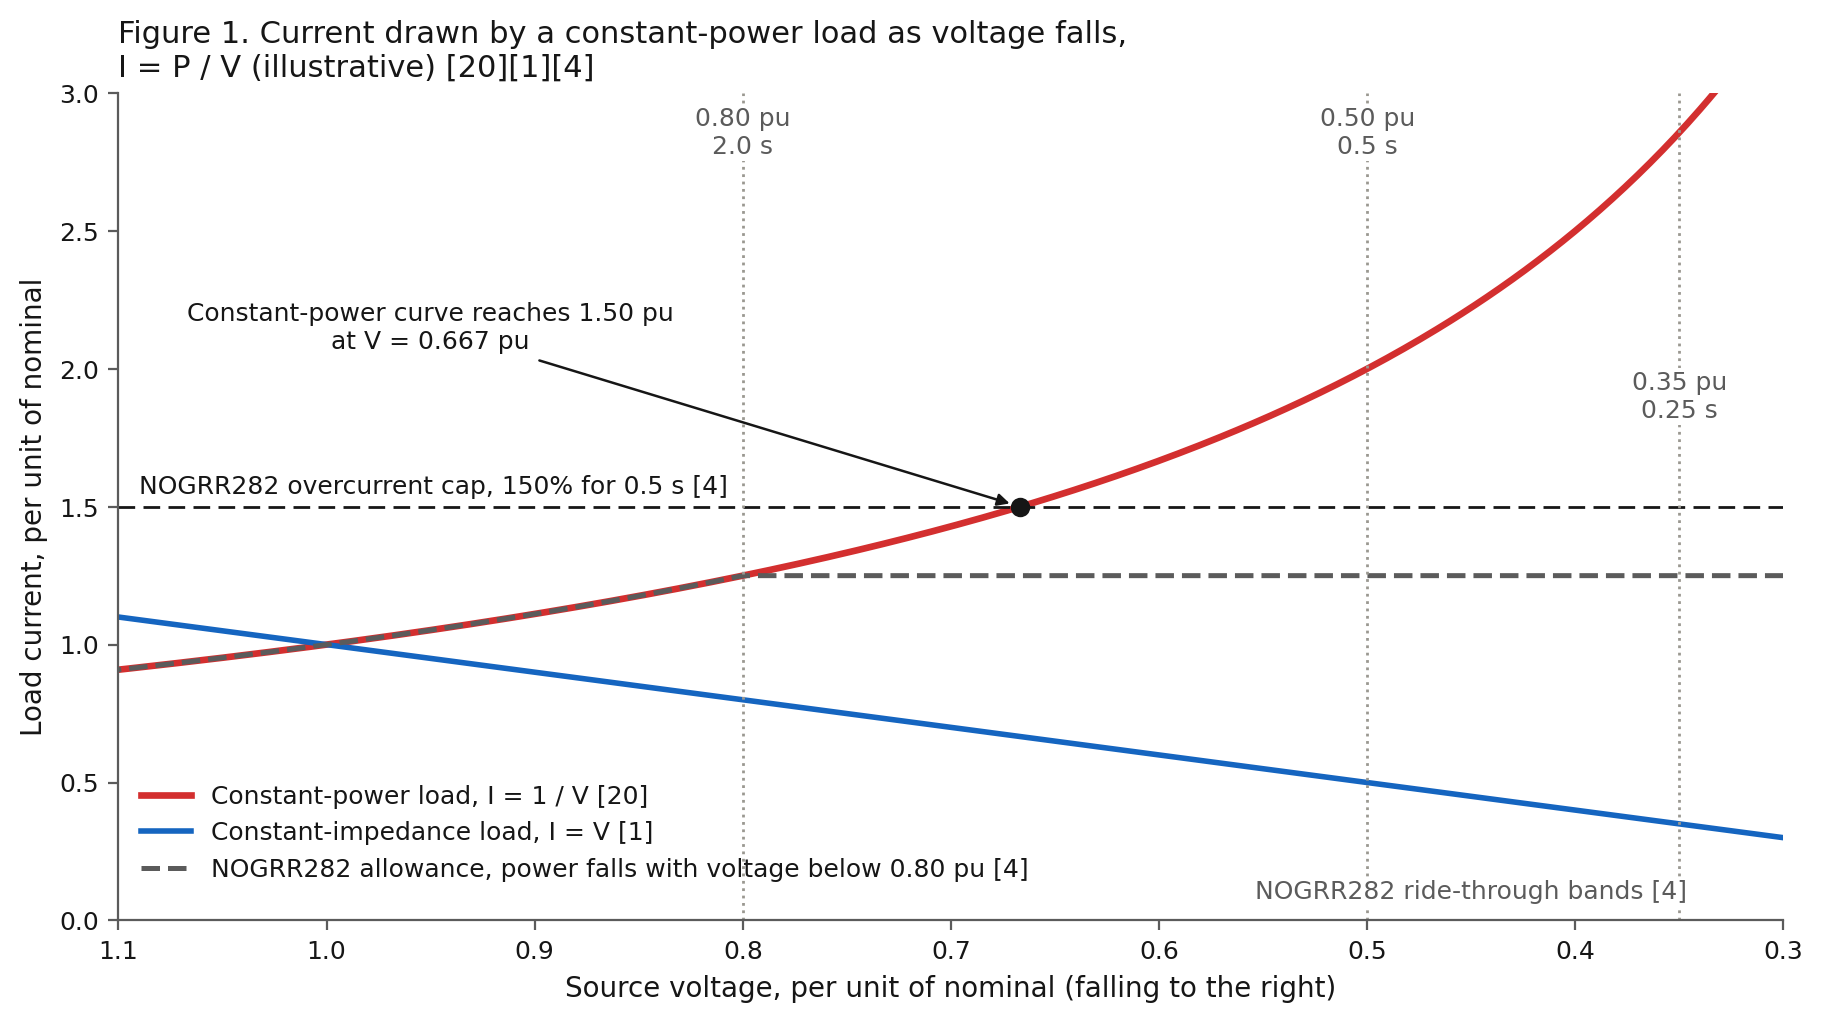
One rule governs every regulated supply. A regulated supply holds its output power. At the input, current equals power divided by voltage, I = P / V 20. Lower the voltage and the current rises. Ingarra reports a test of an inverter under a constant-power load in which the current rose as the input voltage fell, and expects the higher current to add Joule heating 44. The slope of the load’s voltage-current curve is negative, dv/di = minus v/i 20. The constant-power-load literature treats the negative slope as the source of instability 20. The rise in current adds to the voltage drop across the source impedance, V_drop = I × Z 1.
The arithmetic. Take an illustrative 100 kilowatt panel at 480 volts and unity power factor. At nominal voltage the panel draws 120 amperes per phase. At 80% voltage the same power takes 150 amperes, 25% more.
At 50% voltage the panel asks for 241 amperes, twice the current. The arithmetic is linear in power and inverse in voltage.
Who sees the rise. In double conversion the UPS rectifier is the constant-power load at the service point 1. The rectifier draws more input current as the utility sags, up to its own limit 1. Then the UPS transfers to battery 1. The racks behind the inverter see regulated voltage.
On static bypass, in eco mode, on a direct feed or on the mechanical panel, the loads see the source. There the extra current raises the drop across the source impedance. A utility transformer sits at 5 to 7% impedance and a generator at 12 to 20% 12. The Green Grid puts a transformerless static UPS at zero impedance up to its current limit and a UPS with a transformer at 4 to 10% 12.
The rule in the regulation. ERCOT’s NOGRR282, in force since 2026-08-01, is written around the same arithmetic. Ride-through means the load stays connected and keeps drawing power through the disturbance 4. Between 80 and 50% voltage, a large computational load is allowed to reduce consumption in proportion to voltage 4. Below 50% the load reduces as much as needed 4.
During a disturbance the current shall not exceed 150% of the normal maximum 4. Overcurrent up to 150% shall last no longer than 0.5 seconds 4. A constant-power load reaches 150% of its current at 0.667 per unit voltage.
The pulses. A switching supply draws current in short pulses 1,12. Third-harmonic currents from the three phases arrive in the neutral in step and add 1. TM 5-689 puts the theoretical neutral current at 1.73 and as much as 3.0 times the phase current 1. The manual recommends neutral conductors at 200% of the phase rating 1.
The heat. Harmonic current raises hysteresis, eddy current and skin effect losses in transformers 1.
One identity explains the heat. Root-mean-square (RMS) current squared equals the fundamental squared plus the harmonic squared, I_RMS = I_1 × √(1 + THD²) 12,24. Every harmonic ampere adds heating without adding work.
The Green Grid tabulates the result 12. Current distortion of 25% raises conduction loss 6.25%, and 50% raises loss 25% 12. The K-factor carries the same physics into the transformer windings, K = Σ I_h(pu)² × h² 10. Winding eddy loss rises with the square of the harmonic order 10.
One maker’s application table assigns K-13 where harmonic-producing equipment reaches up to 75% of the load 11. That maker’s PDUs ship with a K-13 transformer and a 200% neutral as standard 11. Heat in the transformer, the PDU and the UPS is cooling load. The Green Grid states that harmonic currents reduce the efficiency of the entire data center by increasing the amount of heat to be removed 12.
The source. A given harmonic current makes more distortion on a high-impedance source 1. A UPS output has a current limit, and its distortion depends on its design and output impedance 1.
Makers rate output distortion under 5% with the disclaimer “based on linear loads” 1. IEC 62040-3 classes a sinusoidal UPS output at 8% total distortion or less under linear and reference nonlinear load 22.
The utility side of a double-conversion UPS looks clean. A modern insulated-gate bipolar transistor (IGBT) rectifier draws under 3% current distortion at full load and 5% at half load, at 0.98 power factor 1. The critical bus behind the inverter is where the rack current lands. A UPS does not correct the power factor or harmonics of the racks behind it, and its inverter carries them 1. In bypass or eco mode the same harmonic current flows upstream to the building transformers 12.
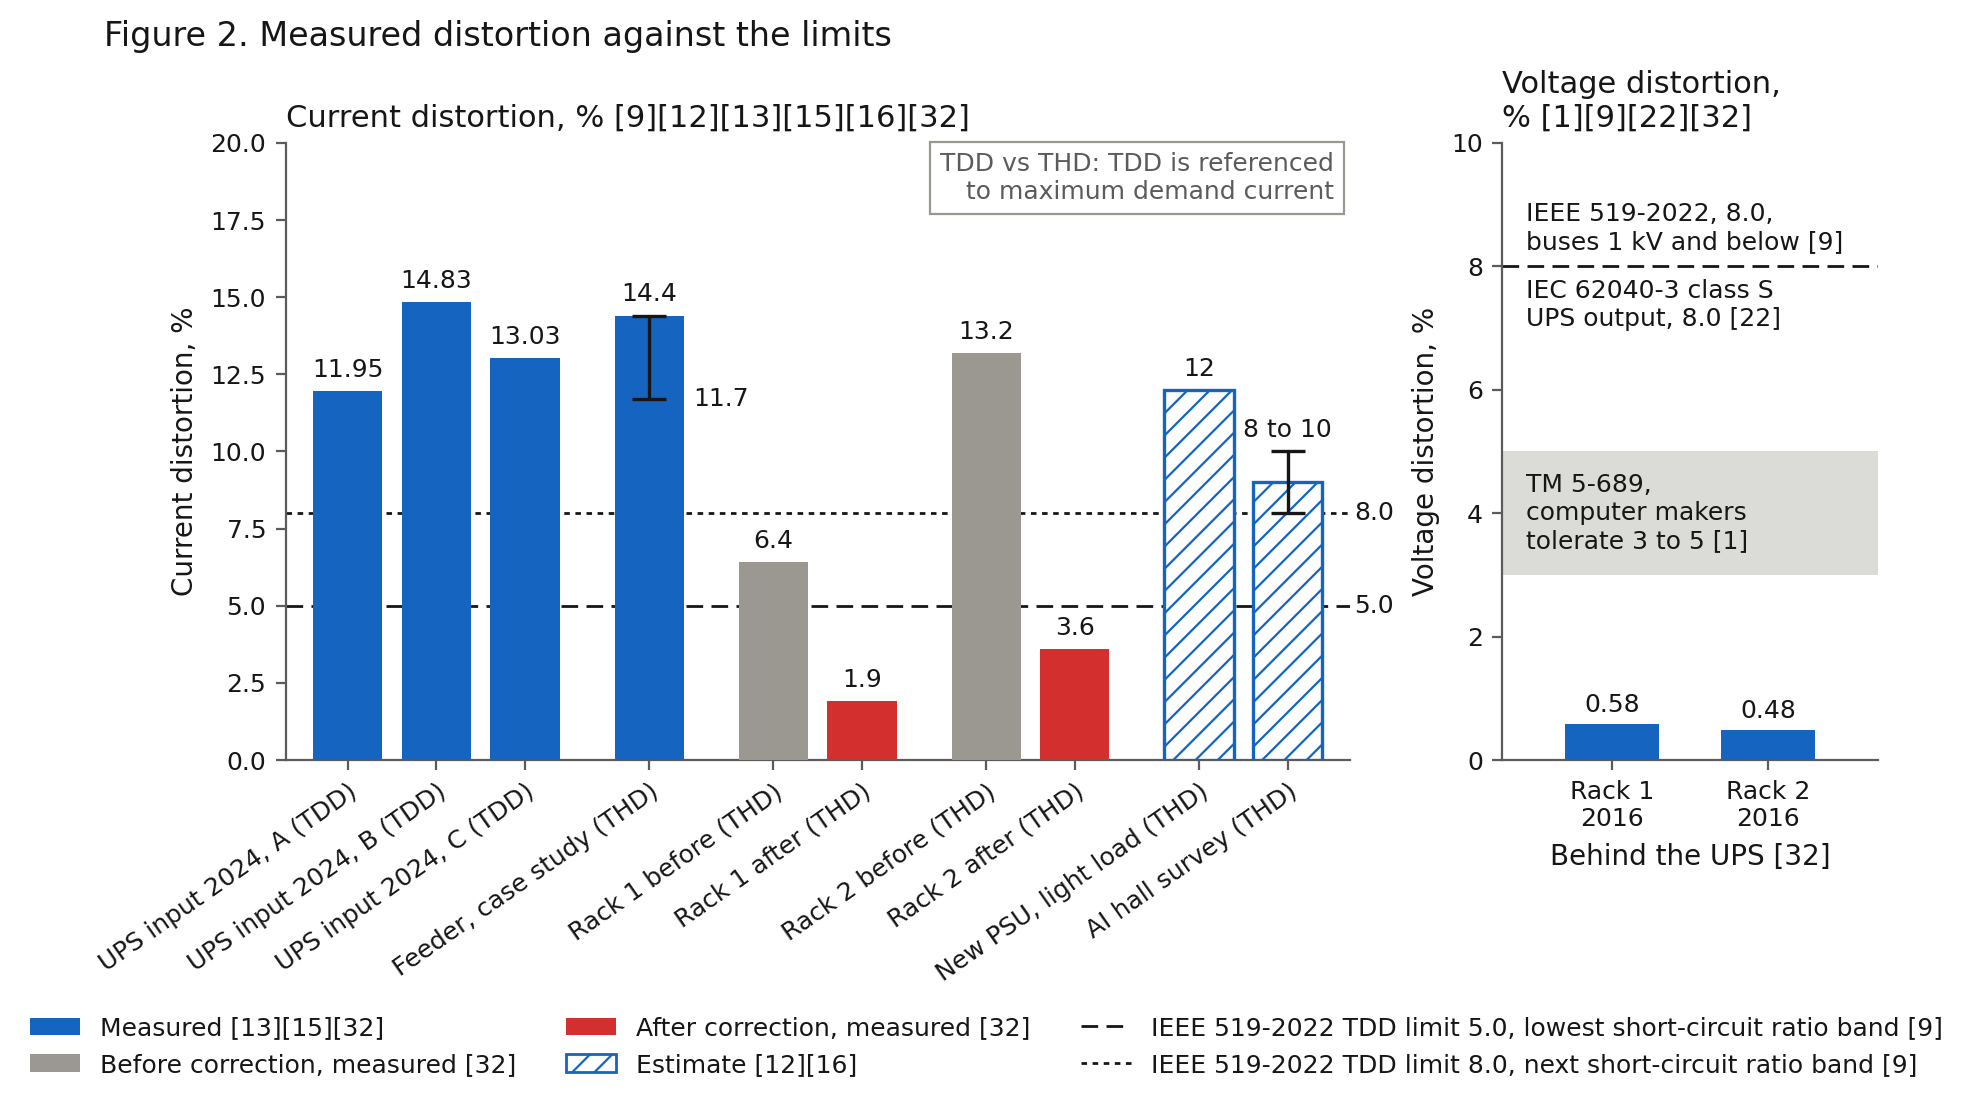
The measurements. A 2024 campus study measured 11.95, 14.83 and 13.03% total demand distortion at a UPS input 15. Two phases sat over a 12% limit 15. Total demand distortion is referenced to the maximum demand current, and current distortion to the fundamental 9. The two agree at full load and diverge at light load 9.
An equipment maker’s case study measured 11.7 to 14.4% current distortion on a data center feeder 13. The measured K-factor was low 13. The same study put it at 1.25, against legacy guidance of K-15 to K-21 13. The Green Grid’s snapshot of a new server supply at light load is 12% current distortion at 0.98 leading power factor 12.
Our server rack assessment covered two racks on 120 volt phases, fed from a UPS through a distribution panel 32. The racks drew about 2.6 and 1.6 kilowatts 32. At the controller connection they measured 6.4 and 13.2% current distortion and power factor 0.931 and 0.831 32. After correction they measured 1.9 and 3.6% current distortion 32. The controller’s own instrumentation took the readings 32.
A 2026 survey of AI data centers estimates distortion from power-electronic loads at 8 to 10% 16. A 2023 measurement in a data center found supraharmonic emission between 2 and 150 kilohertz, with the UPS among the main contributors 17.
The limits. IEEE 519-2022 sets 8% total and 5% per harmonic for voltage on buses of 1 kilovolt and below 9. For current the same standard sets 5 to 20% total demand distortion by the ratio of short-circuit to load current 9. TM 5-689 records computer manufacturers tolerating 3 to 5% voltage distortion with a linear load 1.
Path one, today: utility, UPS, generator, K-rated PDUs and static switches
Most data halls run this way today and will for years. A service transformer feeds 480 volt switchgear 11,21. An automatic transfer switch selects utility or a standby generator and operates within one sixth of a second 1. A double-conversion UPS carries the critical bus with a battery, typically in the range of 15 minutes 1. The room overheats within 15 to 30 minutes if ventilation stops 1.
Static transfer switches give single-corded loads a second UPS source. Dual-corded racks take both feeds directly. Uptime’s Tier III and Tier IV topologies call for concurrently maintainable and fault-tolerant paths 25. Capacitor banks and filters trim power factor and harmonics on the mechanical side 1.
Sizing the generator. TM 5-689 sizes a standby generator for a UPS by the rectifier’s pulse number 1. A 6-pulse rectifier takes 1.6 times the UPS input kilowatts, a 12-pulse rectifier 1.4 times 1. For an IGBT rectifier drawing under 5% distortion, the harmonic multiplier no longer applies 1. Step load and leading power factor then set the size.
A second limit appears when the racks land on the generator through bypass. Server supplies present capacitance to the source, about 2 to 10 microfarads per kilowatt 14. A generator runs unstable when leading reactive current exceeds roughly 20% of its maximum rated current 14. One equipment maker names the case: the UPS in bypass, or a Tier III path with no UPS in front of the racks 14.
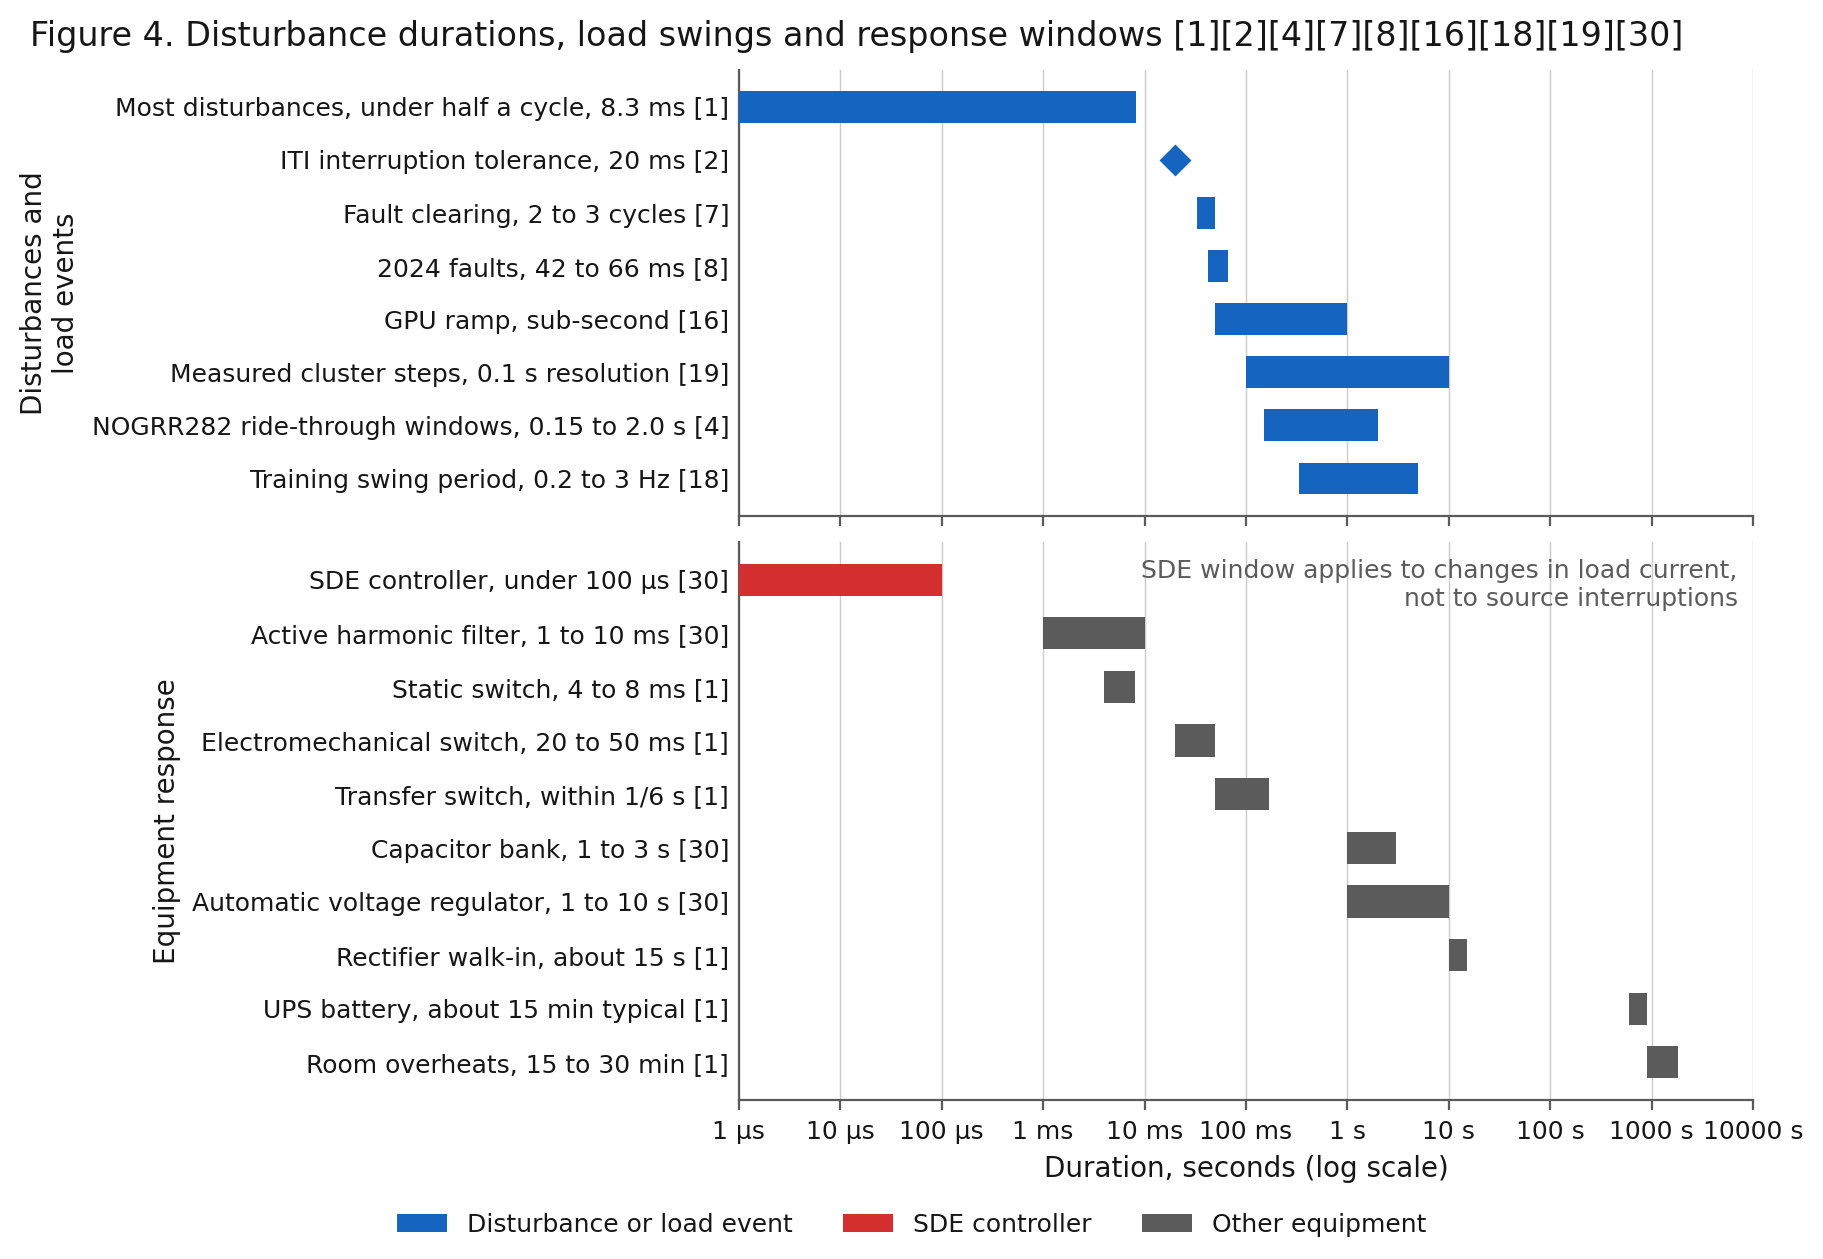
The transfer. A static switch transfers in under 8 milliseconds, an electromechanical switch in 20 to 50 milliseconds 1. Manufacturers build 4 milliseconds to one cycle of ride-through into their equipment 1. The ITI curve tolerates a 20 millisecond interruption 2. On loss of utility the UPS goes to battery and the generator starts.
The rectifier then walks load onto the generator over about 15 seconds 1. The static switch’s silicon-controlled rectifiers (SCRs) drop about 1.5 volts per line, 225 watts per phase in a 150 ampere switch, as heat the room removes 1. TM 5-689 cites a 1974 IBM survey 1. 88.5% of disturbances lasted under half a cycle 1.
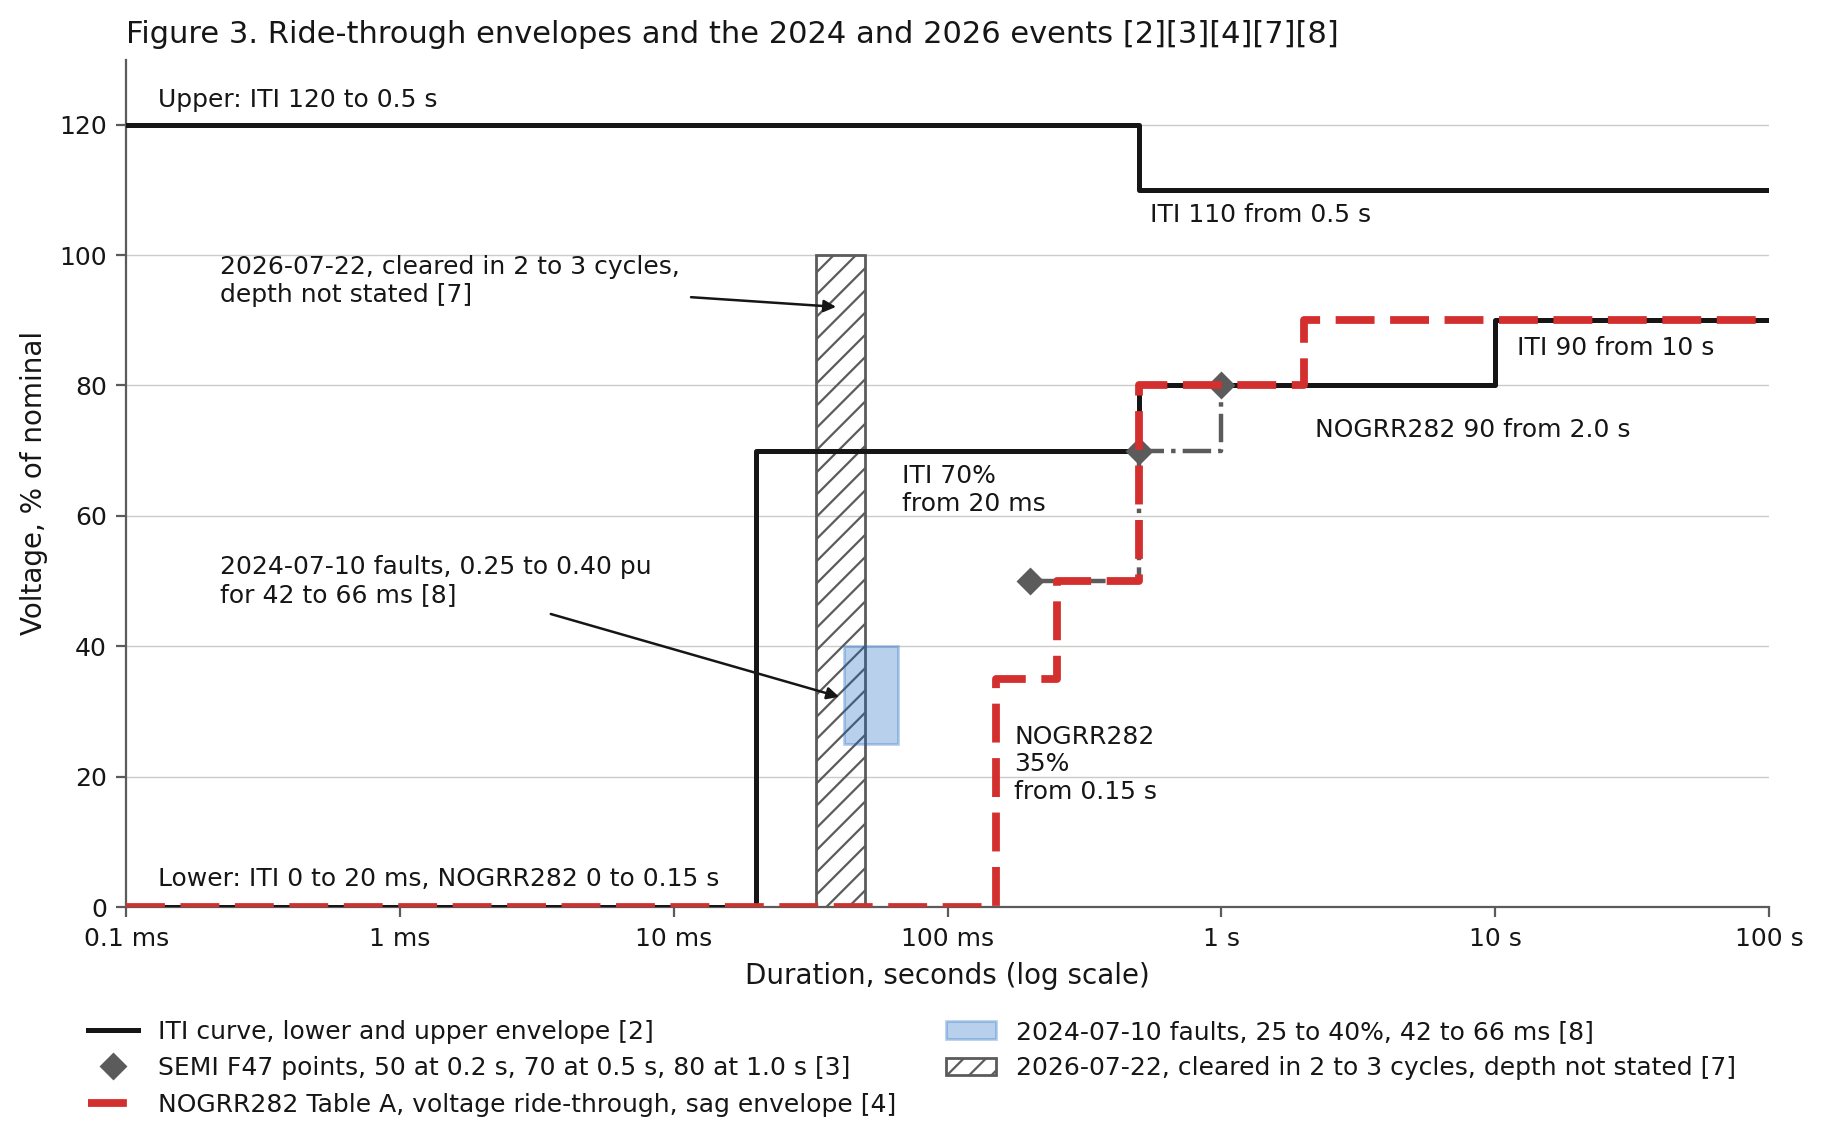
What the July events showed. On 2024-07-10 a lightning arrester failed on a 230 kilovolt line in the Eastern Interconnection 8. Reclosing produced six faults in 82 seconds 8. Each fault cleared in 42 to 66 milliseconds, with voltage at 0.25 to 0.40 per unit in the affected area 8.
About 1,500 megawatts of data center load disconnected 8. Utility equipment tripped none of it 8. Most of the loss, about 1,260 megawatts, left on the third sag and stayed off for hours 8. Facility schemes count sags, typically three in one minute, and transfer to backup until reset 8.
On 2026-07-22 at 07:56 a phase-to-phase fault hit 230 kilovolt line 2031 in the Dominion zone 7. Dominion’s preliminary finding names a sub conductor pulled free from a compression sleeve 7. Improperly torqued bolts are the apparent cause 7. The fault and every reclose attempt cleared in 2 to 3 cycles with no relay misoperation 7.
About 3,800 megawatts, 3,869 by PJM’s count, transferred to backup power during the reclosing attempts 7. Frequency reached 60.092 hertz, and the load returned within 30 minutes 7. PJM’s preliminary finding attributes the transfer to voltage ride-through performance and states the fault cleared properly 7. Dominion’s formal root cause analysis is due in September 2026 7.
Both records make the same point: protection inside the facilities read a cleared fault as a threat. The fault was over. NOGRR282 now prohibits sag-counting trip schemes for sags the load must ride through 4. Where equipment limits force such a scheme, the load shall stay connected through at least six sags in 90 seconds 4.
Capacitors, filters and meters. Capacitor banks and passive filters are analog compensation. Each answers one condition 1. Source inductance resonates with a capacitor bank at a harmonic frequency and amplifies the harmonic 1.
A passive filter is tuned for one load and one source impedance 1. Changing the load, the source or the location degrades the result 1.
A transfer between sources of different impedance, utility to generator, changes the voltage distortion and resonance the filter sees 12.
Crest factor is peak over RMS, 1.414 for a sine and much higher for a pulsed wave 1. Average-sensing meters read pulsed current as much as 50% low 1. Only true-RMS meters, relays and trip units read the rack current correctly 1. The Green Grid warns that the same error reaches PUE arithmetic through rack power strips 12.
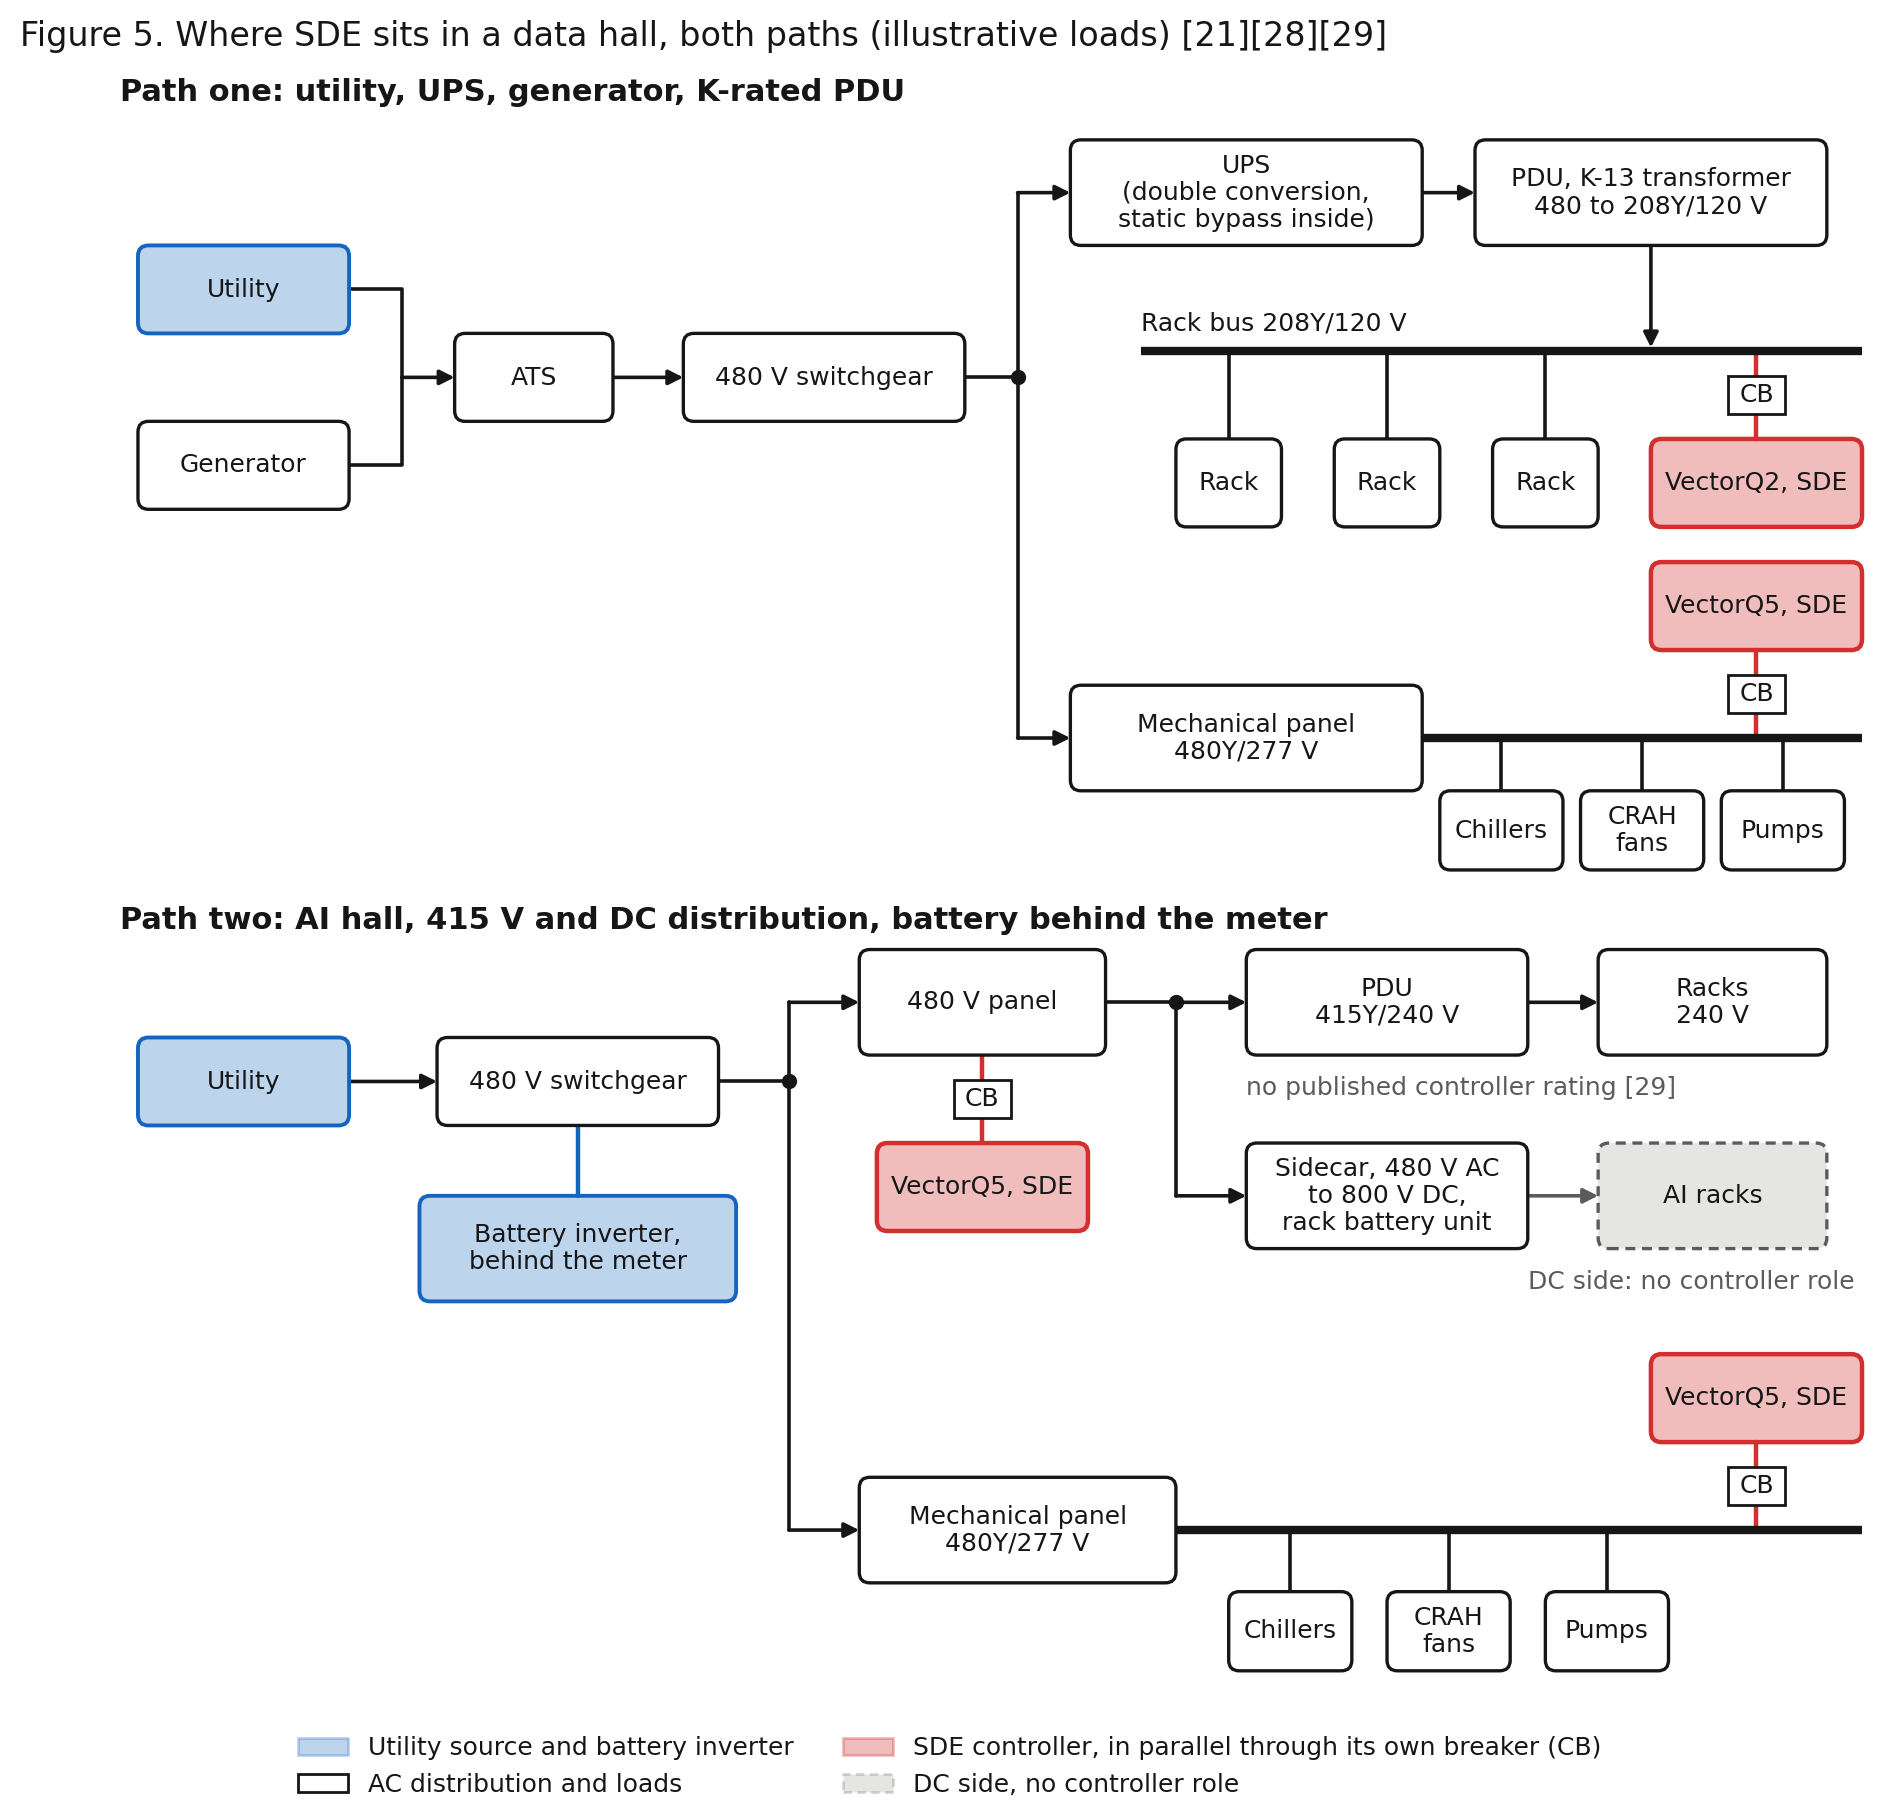
Where the controller connects. The VectorQ controller connects in parallel on the 208Y/120 volt PDU output bus or on the 480Y/277 volt mechanical panel 28,29. The connection runs through the controller’s own breaker, with a three-phase, neutral and ground cable 29.
The controller measures the current of the loads on the panel 28,30. At each instant the controller supplies the reactive, harmonic and unbalanced share of the current 28,30.
What the controller corrects. Correction runs through the 23rd harmonic 29. The range covers the 3rd, 9th, 15th and 21st, the orders adding in the PDU neutral 1,29. The range also covers the 5th, 7th, 11th, 13th, 17th and 19th of the rectifiers 1,29.
The 23rd is the last order corrected. The 25th and higher orders of a rectifier pass uncorrected, and the controller measures them to the 53rd 29. Switching noise at 20 to 100 kilohertz and supraharmonics at 2 to 150 kilohertz stay with the supply’s input filter and the facility’s transient protection 1,17.
Where the correction reaches. In double conversion the utility and the generator feed the UPS rectifier 1. Correction on a PDU behind the UPS lightens the UPS inverter and the PDU transformer 1,12. The correction reaches the utility or the generator only on static bypass, maintenance bypass or eco mode 1,12.
On the mechanical panel the chillers, computer room air handler (CRAH) fans and pumps sit on the utility or the generator directly. Correction there reaches the source at all times.
What our rack assessment measured. The rack current stayed as the servers drew it 32. The corrected values appeared at the controller connection, on the source side of the racks 32. Total current at the connection fell from 23.8 to 22.6 amperes on one rack and from 15.9 to 13.8 amperes on the other 32. Those are sums over three phases, with the reactive share near zero after correction 32.
The assessment supports no energy-saving claim. Corrected active power at the connection ran 57 and 70 watts above uncorrected 32. The controller’s own draw of 39 and 32 watts accounts for part of the difference, and the racks drew the rest 32.
The operating band. The controller is rated for plus or minus 15% on voltage and plus or minus 0.5% on frequency 29. We confirm behavior outside the band in the site network analysis. Every NOGRR282 band below 0.85 per unit lies outside the controller’s rated band 4,29.
During a sag inside its band the controller corrects the load current. The controller does not hold the voltage the source delivers and does not ride through an interruption.
The correction changes one term in a sag: the I × Z share the corrected loads add to the drop on the facility’s own impedance 1. That term is the controller’s share. Those loads present working current only, I = P / V without the reactive and harmonic multipliers 20,24. The UPS, the static switch, the battery and the protection settings decide whether the facility stays connected. The controller does not replace the UPS or the static switch, add kilowatts, cool anything or replace the building management system or the power monitoring system 37.
Coverage. One controller corrects one panel. Loads on other panels stay as they are. Distortion made elsewhere stays where the network makes it 36.
Coverage scales with controller count and rating, sized to each panel. The VectorQ2 is rated for 208 volt panels up to 60 kilowatts and 9 kilovolt-amperes reactive at 50 amperes per phase 29. The VectorQ5 covers 480 volt panels up to 120 kilowatts and 60 kilovolt-amperes reactive at 60 amperes per phase, with multiple units in parallel 29.
Take an illustrative 20 kilowatt PDU section at 208Y/120 volts and power factor 0.93, the figure the first rack in our assessment measured 32. The section draws 59.7 amperes per phase. Of those, 55.5 amperes do work and 22 amperes are reactive. One VectorQ2 supplies the 22 amperes per phase, within its 9 kilovolt-ampere rating 29. The arithmetic is linear and illustrative.
On a UPS output. The controller is a second fast converter on the critical bus. The UPS maker’s application engineer reviews the pairing before a pilot 31.
The UPS keeps its output voltage loop, its current limit and its transfer logic. New server supplies run near 0.98 leading at light load 12. Correcting to unity removes leading current from the inverter.
Through a static bypass or eco-mode transfer the source changes under the controller. The controller is a switching converter with Class A emission, one more switching source on the bus 29. On a mechanical panel, state any capacitor bank or tuned filter in the pilot request. The controller measures their current as load current.
Path two, the future: AI halls, 415 volt and DC distribution, batteries behind the meter, ride-through rules
The rack. Racks are moving from tens of kilowatts to a megawatt. One leading chip maker projects a 1.5 megawatt rack by 2028, ten times today’s server racks 21. The first-generation design feeds 480 volts to a UPS, then 277 volt single-phase to a rack supply with power factor correction 21. The second generation removes the UPS from the power path in some designs and keeps a UPS function in others 21.
The rack takes 277 volts into power shelves and distributes 50 volts DC on a busbar 21. A battery unit and a capacitor unit at the rack back the bus 21. At 200 kilowatts the busbar losses make further growth impractical 21. The third generation converts 480 volt three-phase AC to 800 volt or plus and minus 400 volt DC in a sidecar 21.
The change cuts a megawatt rack’s busbar current from 20,000 to 1,250 amperes 21. The 415 volt distribution used in much of the world outside North America now feeds North American halls too 39. The racks take 240 volts single-phase with no PDU transformer 39.
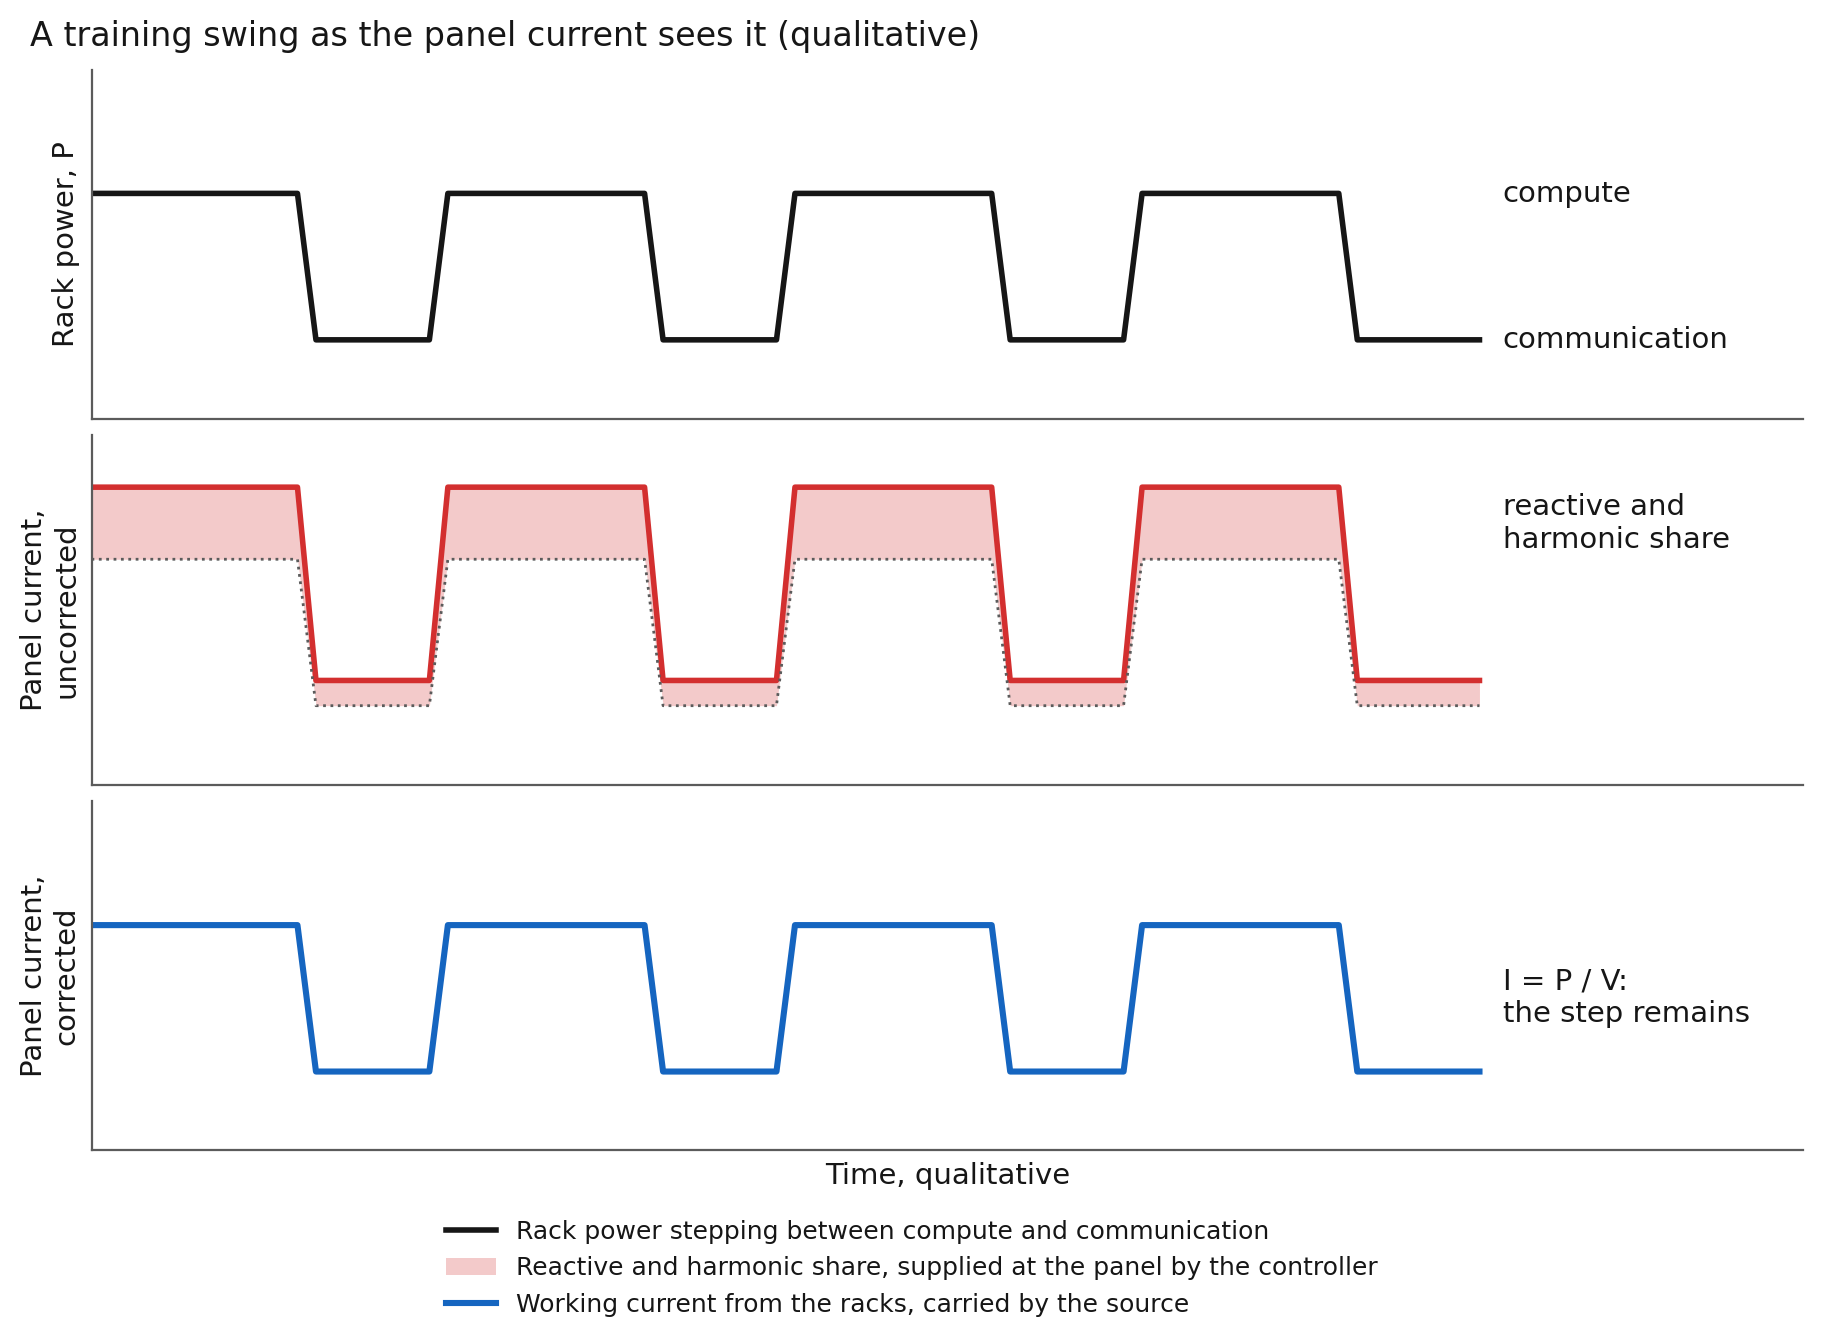
The swings. A survey of AI data centers records one data center GPU stepping from 25.7 to 91.0 watts in sub-second ramps 16. The same survey records a data center load ramping down over 400 megawatts in 36 seconds 16. Engineers at Microsoft, OpenAI and a leading GPU maker describe training jobs alternating between two states 18. Compute runs near the device’s thermal design power, and communication runs near idle 18.
The aggregate swings reach tens of megawatts in one data center and tens or hundreds at scale, concentrated between 0.2 and 3 hertz 18. A measured run on a 16-node GPU cluster swung between about 12 and 48 kilowatts step by step at 0.1 second resolution 19. GPUs draw more than half of a server’s provisioned power 18. Each swing is a step in P. By I = P / V, each swing is a step in current at every panel between the rack and the meter.
The rules. NOGRR282 applies to sites of 75 megawatts or more where at least half the demand is power-electronic computational load 4. The load shall stay connected for 2.0 seconds between 0.80 and 0.90 per unit and for 0.5 seconds between 0.50 and 0.80 4. Below those bands the load shall stay connected for 0.25 seconds between 0.35 and 0.50 per unit and for 0.15 seconds under 0.35 4. ERCOT measures the RMS voltage at the service delivery point 4. Loads in service or approved to energize on or before 2025-11-14 are exempt, unless a later modification meets the study criteria 4.
Cooling and mechanical load is allowed to trip below 0.35 per unit 4. The load shall stay connected between 58.8 and 61.2 hertz 4. Outside those bands the load shall stay connected for 299 seconds, to 63.0 and 57.5 hertz 4. A load-transfer scheme is allowed below 0.80 per unit if consumption returns to 90% within 0.5 seconds of recovery 4.
NERC’s PRC-029-2 requires inverter-based resources, battery storage among them, to stay connected through defined voltage and frequency excursions from 2026-10-01, and it does not apply to loads 5. Loads come next 6. FERC’s order of 2026-07-16 directs NERC to file reliability standards for computational load integration by 2026-12-31 6. The order also asks for a glossary definition and registration criteria by 2026-12-31, and a work plan by 2027-03-01 6.
The battery inverter. A behind-the-meter battery smooths the swings the AI sources describe 18. This is the Generation pillar arriving inside the hall. Adding a source adds a current budget of its own.
Into a fault, an inverter delivers about 1.1 to 1.5 times its rated current 27. Real power, reactive support and harmonic current for the loads on the same bus draw on one current budget 24.
RMS current adds them as the root of the sum of squares 24. Take the power factor of the second rack in our field assessment, 0.83 32. A feeder at that figure asks its source for 20% more current than the working current 32. New supplies run near 0.98 at full load and leading at light load, so the margin on an AI feeder is smaller 12.
SDE’s role on this path. No rating is listed for 415Y/240 volt networks. Our product specification, R034B, lists 208 and 480 volt models and custom voltages on request 29. A 415 volt hall is a custom application until a rating is published. On a 480 volt panel feeding sidecars, power shelves or a 415 volt PDU, a VectorQ5 corrects the current of the converters on the panel 29.
The switchgear, the utility transformer and the battery inverter then carry working current from those loads. The count follows the reactive and harmonic share of the panel current, not the kilowatts 29. On the DC side of a sidecar the controller has no role.
The swings and the controller. The reactive and harmonic share of each swing stays at the panel, and the source carries the step in working current. The step itself remains, and it is the source’s job: the battery, the rack capacitor unit or the grid.
On the mechanical panel the correction reaches the utility and the battery inverter at all times, as on path one. The controller does not form the bus, dispatch the battery, hold frequency or supply real power. Its fault contribution is limited to its own current limit 29.
Why SDE is critical on both paths
Software-Defined Electricity measures the full three-phase waveform at nanosecond resolution and corrects the current waveform digitally, at the load, in microseconds 28,29,30. It runs three steps continuously.
- Measure. The controller reads the full waveform on the three phases at the panel 28,29. The VectorQ controller samples the waveform 1,000 or more times per cycle 29.
- Model. It separates the load current into the working current and the reactive, harmonic and unbalanced share 30.
- Correct. It supplies that share at the panel, as the negative of those components 28,30. The source then carries working current for the corrected loads.
The controller connects in parallel at the panel, through its own breaker, and sits outside the current path 29,31. It installs without interrupting the circuit 31. Removing or powering down the controller leaves the panel as installed 29.
The rule. Correction removes the multipliers on the current, the reactive share and the harmonic share 24,28. The source carries P / V for those loads, plus the controller’s own draw, up to the controller’s rating 29. The current through the source impedance falls with the correction, at nominal voltage and through a sag inside the band 1,29. The P / V rise in a sag remains.
The neutral. Third-harmonic currents add in the PDU neutral, with the imbalance between phases on top 1,28. Supply the third harmonic and the unbalanced fundamental at the panel, and the feeder neutral carries near zero for phase-to-neutral loads, by its rating 29. Supplies wired phase-to-phase put little on the neutral to begin with 12. No data center neutral-current measurement is on file. In our field assessment the phase power spread on one rack fell from minus 39 and plus 40% to within 1.4% of average 32. On the other rack the spread fell from plus 39 and minus 50% to within 1.6% 32.
Rating and heat. For the corrected loads, the PDU transformer and the UPS inverter carry working current 1,24. Ingarra reports the same mechanism on an inverter’s DC input: under a constant-power load the current rose as the input voltage fell, and he expects the extra current to show up as Joule heating 44. The PDU keeps its K-rating, because removing the controller returns the harmonics 29. While correction runs, the heating those ratings guard against falls for the corrected loads, up to the 23rd order and the unit’s rating 1,10,29. Conduction loss falls with the square of current 1. On the second rack the report’s own per-phase I²R sum fell 20% with correction on, and on the first rack 9% 32. Less heat in the transformer, the PDU and the UPS is less heat for the cooling plant to remove from those items 12. The controller’s own losses land in the same room. They run about 200 watts typical, the maker’s figure, with heat dissipation up to 2.4 kilowatts on the VectorQ2 and 3.6 on the VectorQ5 at full correction 29. The net heat balance depends on the panel’s distortion and is not on file. The case for correction rests on rating headroom, neutral current and the record, not on cooling load. We state no PUE figure, because no measurement on file supports one.
Speed. The static switch needs under 8 milliseconds, an electromechanical switch 20 to 50 and a capacitor bank 1 to 3 seconds 1,30. A training swing repeats every 0.3 to 5 seconds 18. The controller corrects a change in load current in under 5 microseconds 29. A rack stepping to peak or a rectifier shifting its harmonics is such a change. Interruptions, sags and impulses on the source stay with the UPS, the switches and the surge protection.
The customer’s account. In 2018 the chief executive of Freudenberg’s American information technology unit described a test in the company’s data center to Vox 33. On switch-on, power consumption dropped about 20% and server temperature about 20 degrees 33. He checked the result against his own UPS displays by switching the unit off and on 33. The account, with its context, is on Press and Case Studies 31. The account is a customer’s account, not a measurement. The instrumented assessment of two racks found no drop in active power at the connection 32. Both records are published, and the measurement stands.
Network error rate. A second effect was observed in a data center. On racks under correction, the network switches logged a small and consistent drop in packet error rate with correction on 34. The observation comes from the site’s own switch counters and is unpublished 34. The record holds no error-per-packet rate and no count of on-off comparisons.
The proposed mechanism has three steps. Correction lowers neutral current. Part of the return current flows in the grounding system where a neutral-to-ground bond exists downstream of the source 1. Part flows through the input filter capacitors of the supplies 1.
Lower ground current means lower voltage between the chassis of separately fed equipment. TM 5-689 lists a potential difference along a grounding conductor between two pieces of data processing equipment as a cause of data errors 1. IEEE 1100-2005, now inactive, lists stray current in the equipment grounding conductor as a cause of random data errors 26. The same table adds “particularly in analog-based rather than digital-based systems” 26.
Two facts weaken the chain. Ethernet ports are transformer isolated, and fiber carries no conducted path. The route to the error counter is not established. Supply ripple and temperature are not excluded. For an AI hall the question is worth answering.
Meta’s Llama 3 team reports a single straggler slowing thousands of GPUs 40. No throughput figure is attached to the observation. The proposed test measures four things together: ground current at the rack, chassis-to-chassis voltage, per-port error counters by link type and training step time. The measurements run with correction on and off, in alternating blocks.
Protection. Lower RMS load current, with harmonics and reactive current removed, widens the gap between load level and trip level. The controller’s breaker and fault contribution enter the coordination study like any other panel device. The controller is not compatible with residual-current or GFCI devices on its branch 29. Its touch current is limited to 3.5 milliamperes AC 29. State any ground-fault protection or monitoring on the panel in the pilot request.
Listing, environment and interfaces. The controller holds CE conformity assessment per IEC 62477-1 29. The controller is not UL listed, and each installation carries a UL field evaluation 29. The controller is an indoor IP20 unit rated for minus 5 to plus 42 degrees Celsius, 85% humidity and 1,000 meters altitude, with Class A EMC 29. The panel’s source supplies the controller’s loss and the room’s cooling removes the heat 29. We build the controller in Pittsboro, North Carolina, with global components 29. The controller’s network interface enters the facility’s segmentation like any other panel device.
Cyber resilience. The controller has no internet dependency and operates autonomously, and commissioning needs no laptop and no software 29. A 2021 piece that WIRED Brand Lab produced for Deloitte quotes Sharon Chand of Deloitte Risk and Financial Advisory. She says software-defined electricity will increase the cyber risk profile of companies that adopt it. The piece adds that it can directly increase cyber resilience by aligning the data it collects to help companies identify threats “virtually undetectable through other sources” 38. The piece does not name 3DFS.
Observability. Class A power quality meters compute magnitudes over 10 or 12 cycles, about 200 milliseconds, and detect dips at half-cycle resolution 23. NOGRR282 requires a root cause report within 90 days of a ride-through failure on ERCOT’s request 4. The controller measures the full waveform of the loads under correction and logs each correction, at the panel, where the current forms 31. The power monitoring system shows the result at the switchgear. The panel record shows the current the racks drew through the event.
We ship the VectorQ2 for 208 volt and the VectorQ5 for 480 volt networks, and both are in production 31. The network analysis sets controller count and rating 31.
The data center evidence on record is the three items above 32,33,34. Outside a data center, a 2020 externally funded trial at our facility, with an independent third party, sits on the public record 35.
Pilots start with an on-site electrical network analysis measured against the facility’s own baseline 31.
Start with a one-week measurement at one PDU before specifying a controller. Send us the panel voltage, the UPS make and model, and whether the racks sit behind the UPS or on a direct feed. State any ground-fault protection, capacitor bank or passive filter on the panel.
Four PQ Components pages explain the mechanisms behind this page. Harmonics is the rectifier current, the neutral and the K-rated transformer. Phase Balance is the uneven single-phase load and the neutral it fills. Voltage Stability is the sag, the ride-through curve and the 2024 event that made it a grid problem. Standards Compliance is IEEE 519, ERCOT and FERC, each with its window and its point.
Frequently asked questions
What does NERC PRC-029 ride-through mean for large data center loads?
PRC-029-2 places no requirement on loads. It sets ride-through for inverter-based resources, battery storage among them, from 2026-10-01 5. Loads come next: FERC’s order of 2026-07-16 directs NERC to file reliability standards for computational load integration by 2026-12-31, with glossary definitions by the same date, registration criteria expected by then and a work plan by 2027-03-01 6. In ERCOT, NOGRR282 has set ride-through for large computational loads since 2026-08-01 4.
How should a data center prepare for ERCOT NOGRR282 ride-through requirements?
Start with the protection settings, because NOGRR282 prohibits sag-counting trip schemes for sags the load must ride through 4. The rule applies to sites of 75 megawatts or more where at least half the demand is power-electronic computational load 4. The load shall stay connected for 2.0 seconds between 0.80 and 0.90 per unit and 0.5 seconds between 0.50 and 0.80 4. The UPS, the static switch, the battery and the protection settings decide whether the facility stays connected.
Software-Defined Electricity is not a UPS and satisfies no ride-through standard on its own 37.
Why did 1,500 MW of data center load drop off the grid during a single fault?
It was six faults in 82 seconds, not one, and the facilities’ own protection tripped the load, not the utility 8. On 2024-07-10 a lightning arrester failed on a 230 kilovolt line, and reclosing produced faults cleared in 42 to 66 milliseconds 8. Facility schemes count sags and transfer to backup until reset, so about 1,260 megawatts left on the third sag for hours 8. In ERCOT, NOGRR282 now prohibits such schemes for sags the load must ride through 4.
How can harmonics in a 208 V server rack be reduced without changing the servers?
Supply the harmonic current at the panel. Our VectorQ controller connects in parallel on the 208Y/120 volt PDU output bus through its own breaker and supplies the reactive, harmonic and unbalanced share of the rack current 28,29. Correction runs through the 23rd harmonic, covering the triplens that add in the neutral and the rectifier orders 1,29. In our rack assessment, current distortion at the controller connection fell from 6.4 and 13.2% to 1.9 and 3.6% 32.
Does a UPS correct power factor and harmonics on the facility side?
Not on the critical bus. A double-conversion UPS with a modern IGBT rectifier draws under 3% current distortion at full load and 5% at half load, at 0.98 power factor, so its utility side looks clean 1. It does not correct the power factor or harmonics of the racks behind it, and its inverter and the PDU transformer carry them 1,12. In bypass or eco mode the same harmonic current flows upstream to the building transformers 12.
Software-Defined Electricity is not a UPS. It supplies the reactive, harmonic and unbalanced share of the rack current at the panel 28,29, and the UPS still carries the ride-through 37.
How can a data center free up electrical capacity without new transformers?
Where kVA is the limit, supplying the reactive, harmonic and unbalanced share at the panel can let the same ratings carry more useful load 24,28. Current that does no work fills the rating of each PDU, UPS and transformer it crosses 12,24. In an illustrative 20 kilowatt PDU section at 0.93 power factor, 55.5 of the 59.7 amperes per phase do work and 22 are reactive, which one VectorQ2 supplies within its 9 kilovolt-ampere rating 29.
Sources
- U.S. Army. TM 5-689, ADP/Computer Electrical Installation and Inspection for Command, Control, Communications, Computer, Intelligence, Surveillance, and Reconnaissance (C4ISR) Facilities. Headquarters, Department of the Army, 2001-09-10. Paragraphs 2-3 i(2) (1974 IBM study, 88.5% of disturbances under 0.5 cycle), 3-4 g (UPS high output impedance), 3-4 g(3) (static switch about 4 milliseconds, electromechanical 20 to 50 milliseconds), 4-6 b(2) (208Y/120 volt supply with grounded neutral), 4-6 b(7) (ground loops, ground currents as noise causing errors), 4-6 c(2) (potential difference between the ends of a grounding conductor joining two pieces of data processing equipment, data errors), 5-4 (capacitor resonance), 5-5 b (nonlinear load current not proportional to voltage, switcher duty cycle, 20 to 100 kilohertz, switching supplies as a major nonlinear load), 5-6 c and d (triplen summation, 1.73 to 3.0 times), 5-7 a, b and c (hysteresis, eddy current, skin effect, 70% over-temperature, derating), 5-9 a, b and c (E = I × Z, UPS output disclaimer, IGBT rectifier input), 5-11 b(3) (tuned filter sensitivity to load, source and location), 5-12 a(2) and b (average-sensing meter error up to 50%, crest factor 1.414), 5-13 a and d (200% neutral, true-RMS meters, relays and trip units), 6-1 b and Table 6-1 (4 milliseconds to 1 cycle of ride-through, manufacturer tolerances), 6-4 (battery support times in the range of 15 minutes typical, rooms overheat within 15 to 30 minutes), 6-4 a (power walk-in over about 15 seconds), 6-4 c (1.6 and 1.4 multipliers), 6-6 e (transfer within 1/6 second) and 6-6 m (static switch under 8 milliseconds, 20 millisecond outage per the ITI curve, 1.5 volt SCR drop and 225 watts per phase). The WBDG URL serves the 2001 edition. The 2006 edition renumbers chapter 5 from paragraph 5-10 onward by one and gives 15 minutes minimum and a 10 second walk-in. https://www.wbdg.org/FFC/ARMYCOE/COETM/tm_5_689.pdf
- Information Technology Industry Council, Technical Committee 3. ITI (CBEMA) Curve Application Note, revised 2000. Sections 3.1 (plus or minus 10%), 3.2 (swell to 120% for 0.5 seconds), 3.5 (sags to 80% for 10 seconds, 70% for 0.5 seconds) and 3.6 (dropout up to 20 milliseconds). https://www.itic.org/resources/Oct2000Curve-UPDATED.doc
- SEMI F47-0706 (Reapproved 0812), Specification for Semiconductor Processing Equipment Voltage Sag Immunity. Current revision, text paywalled. Envelope points as reproduced by Pacific Gas and Electric, Power Quality Bulletin Issue 3, 2018-07 (50% for 200 milliseconds, 70% for 0.5 seconds, 80% for 1.0 second, no requirement below 50%). https://store-us.semi.org/products/f04700-semi-f47-specification-for-semiconductor-processing-equipment-voltage-sag-immunity and https://www.pge.com/assets/pge/docs/contact-us/report-an-issue/Power_Quality_Bulletin_Issue3.pdf
- ERCOT. NOGRR282, Board Priority, Large Computational Load Ride-Through Requirements, PUCT Report 282NOGRR-45, approved by the Public Utility Commission of Texas 2026-07-09 under Project 54445, effective 2026-08-01. Nodal Operating Guide sections 2.6.4 (frequency ride-through Table A) and 2.15 (voltage ride-through Table A, paragraphs (3)(c) proportional reduction between 0.80 and 0.50 per unit and reduction as needed below 0.50, (3)(d) 150% overcurrent for no more than 0.5 seconds, (3)(e) load-transfer schemes, (7) six sags in 90 seconds, (8) root cause report within 90 days). Companion NPRR1308, Protocol section 2.1 (Large Load 75 megawatts or more, Large Computational Load 50% or more power-electronic computational load). https://www.ercot.com/mktrules/issues/NOGRR282 and https://www.ercot.com/files/docs/2026/07/11/282NOGRR-45-PUCT-Report-070926.docx
- NERC. PRC-029-2, Frequency and Voltage Ride-through Requirements for Inverter-Based Resources, approved by FERC letter order issued 2026-09-30, Docket RD26-10-000, mandatory and enforceable 2026-10-01. It superseded PRC-029-1 (FERC Order No. 909, Docket RM25-3-000, 2025), retired 2026-09-30 before its own effective date. Applicable to generator owners of inverter-based resources, with the 20 megavolt-ampere, 60 kilovolt non-BES tier from 2027-01-01 carried forward unchanged in the PRC-029-2 implementation plan. https://www.nerc.com/globalassets/align-reports/one-stop-shop.xlsx
- Federal Energy Regulatory Commission. Order Directing the North American Electric Reliability Corporation to File Reliability Standard(s) Pertaining to Computational Load Integration, Docket No. RD26-7-000, issued 2026-07-16, ordering paragraphs (A) to (C) (standards and glossary definitions by 2026-12-31, Rules of Procedure revisions expected by 2026-12-31, informational work plan by 2027-03-01). https://www.ferc.gov/sites/default/files/2026-07/RD26-7-000.pdf
- PJM Interconnection. July 22, 2026 Dominion Load Transfer Event, presentation to the PJM Operating Committee, 2026-08-06, with Dominion preliminary findings of 2026-08-05 (approximately 3,800 megawatts and 3,869 megawatts transferred to backup power at 07:56, phase-to-phase fault on 230 kilovolt line 2031, a sub conductor pulled free from a compression sleeve with improperly torqued bolts as the apparent cause, faults and reclose attempts cleared in 2 to 3 cycles, no relay misoperations, fault cleared properly, frequency 60.092 hertz, ACE plus 3,928 megawatts, load returned within 30 minutes, transfer likely due to voltage ride-through performance, Dominion root cause analysis due September 2026). https://www.pjm.com/-/media/DotCom/committees-groups/committees/oc/2026/20260806/20260806-item-05—dominion-july-loss-of-load-event—presentation.pdf
- North American Electric Reliability Corporation. Incident Review: Considering Simultaneous Voltage-Sensitive Load Reductions, 2025-01 (2024-07-10 event: 230 kilovolt line fault in the Eastern Interconnection, six faults in 82 seconds, 42 to 66 milliseconds each, 0.25 to 0.40 per unit, approximately 1,500 megawatts disconnected on the customer side, approximately 1,260 megawatts at the third depression not returning for hours, counting schemes typically three disturbances in one minute, frequency 60.047 hertz). https://www.nerc.com/globalassets/our-work/reports/event-reports/incident_review_large_load_loss.pdf
- IEEE Std 519-2022, IEEE Standard for Harmonic Control in Electric Power Systems. Table 1 (voltage distortion limits for buses of 1 kilovolt and below: 5.0% individual, 8.0% total) and Table 2 (current distortion limits for 120 volt through 69 kilovolt systems, total demand distortion 5.0 to 20.0% by short-circuit ratio, referenced to maximum demand current). Active. Standard text paywalled. Values as reproduced by secondary sources. https://standards.ieee.org/ieee/519/10677/
- IEEE Std C57.110-2018, IEEE Recommended Practice for Establishing Liquid Immersed and Dry-Type Power and Distribution Transformer Capability when Supplying Nonsinusoidal Load Currents (harmonic loss factor, winding eddy-current loss proportional to the square of harmonic order). Active. UL 1561 K-factor, K = Σ I_h(pu)² × h², as reproduced in a leading maker’s K-factor technical paper 1TQC194900E0001, 2023. https://standards.ieee.org/ieee/C57.110/5948/
- Application bulletin on harmonics in electrical systems, pages 5 and 6 (480 volt utility power stepped down through a transformer to 208 volts for the racks, K-factor table: K-4 under 35%, K-7 under 50%, K-13 under 75%, K-20 up to an all harmonic-producing load, PDUs standard with a K-13 transformer and 200% neutral). Project file HarmonicsInYourElecSystem.pdf.
- The Green Grid. White Paper 55, Data Center Power System Harmonics: An Overview of Effects on Data Center Efficiency and Reliability, 2013 (executive summary on heat to be removed and metering accuracy for PUE, page 8 supplies wired phase-to-phase reducing triplen neutral current, page 9 Table 1 typical new PSU at light load 12% current distortion and 0.98 leading power factor, page 10 harmonics in bypass and eco mode flowing upstream, pages 10 to 11 source impedance, load transfer between sources of different impedance changing distortion and resonance, page 15 Table 3 impedance of transformerless UPS, utility transformer 5 to 7%, UPS with transformer 4 to 10%, generator set 12 to 20%, page 20 Table 4 RMS current and loss factors by current distortion, page 24 IEEE 519 as a point of common coupling standard, page 27 neutral at 1.7 times phase current, page 28 measurement at the load versus the panel). https://www.thegreengrid.org/en/resources/library-and-tools/380-WP%2355—Data-Center-Power-System-Harmonics
- Rasmussen, N. Harmonic Currents in the Data Center: A Case Study. A leading maker’s White Paper 38, Revision 1 (feeder current distortion 11.7 to 14.4%, most branch circuits under 20%, measured K-factor 1.25 against legacy guidance of K-15 to K-21). https://download.se.com/files?p_Doc_Ref=SPD_SADE-5TNRJN_EN&p_File_Name=SADE-5TNRJN_R1_EN.pdf
- Rasmussen, N. Impact of Leading Power Factor on Data Center Generator Systems. A leading maker’s White Paper 200 (power supply capacitance about 2 to 10 microfarads per kilowatt, generator instability above about 20% leading reactive current, the case of the UPS in bypass or a path with no UPS). Vendor white paper.
- Alawasa, K. M. and Al-Badi, A. H. Investigation and Analysis of the Power Quality in an Academic Institution’s Electrical Distribution System. Energies 17(16), 3998 (2024). Section 3.2.2 (UPS connection point in a university distribution system, total demand distortion 11.95, 14.83 and 13.03% on phases A, B and C against a 12% limit). Open access. https://doi.org/10.3390/en17163998
- Ginzburg-Ganz, E., Lifshits, P., Machlev, R., Belikov, J., Krieger, Z. and Levron, Y. Technical Challenges of AI Data Center Integration into Power Grids: A Survey. Energies 19(1), 137 (2026). Section 2.2 (one data center GPU from 25.7 to 91.0 watts in sub-second ramps), section 3.2 (load ramp of over 400 megawatts in 36 seconds), section 3.3 and Figure 13 (harmonic distortion from power-electronic loads about 8 to 10%, survey estimate). Open access. https://doi.org/10.3390/en19010137
- Sutaria, J. and Rönnberg, S. K. Propagation of Supraharmonics in a Data Center With Different Operating Modes of UPS. IEEE Access 11, 36823 to 36833 (2023). Abstract (supraharmonic emission 2 to 150 kilohertz, UPS among the main contributors, magnitude dependent on UPS mode and load). Open access. Measured magnitudes not asserted. https://doi.org/10.1109/ACCESS.2023.3266092
- Choukse, E. et al. Power Stabilization for AI Training Datacenters. arXiv:2508.14318, version 2, 2025-08-21 (compute phase near thermal design power and communication phase near idle, drops from once per second to once every tens of seconds, aggregate swings of tens of megawatts in one data center and tens or hundreds at scale, FFT energy concentrated between 0.2 and 3 hertz, GPUs above 50% of provisioned server power). Preprint, not peer reviewed. https://arxiv.org/abs/2508.14318
- Vercellino, R. et al. Measurement of Generative AI Workload Power Profiles for Whole-Facility Data Center Infrastructure Planning. arXiv:2604.07345, version 1, 2026-04-08 (16-node GPU training run swinging between about 12 and 48 kilowatts at 0.1 second resolution, section 3.3 and Figure 6). Preprint, not peer reviewed. https://arxiv.org/abs/2604.07345
- AL-Nussairi, M. Kh., Bayindir, R., Padmanaban, S., Mihet-Popa, L. and Siano, P. Constant Power Loads (CPL) with Microgrids: Problem Definition, Stability Analysis and Compensation Techniques. Energies 10(10), 1656 (2017). Section 3.1, equation 3 (a constant-power load draws i = P / v, incremental resistance dv/di = minus v/i, negative slope of the voltage-current curve, treated as the source of instability). Open access. https://doi.org/10.3390/en10101656
- McDonald, B. Data centers evolve to meet AI’s massive power needs. A leading chip maker’s technical article SSZTDB4, 2025-11 (1.5 megawatt rack by 2028, first-generation 480 volt UPS and 277 volt rack supplies with power factor correction, second-generation 50 volt DC busbar with battery and capacitor backup at the rack, some designs retaining a UPS function, 200 kilowatt limit, third-generation 800 volt or plus and minus 400 volt DC sidecar, busbar current from 20,000 to 1,250 amperes). https://www.ti.com/lit/ta/ssztdb4/ssztdb4.pdf
- IEC 62040-3:2021, Uninterruptible power systems (UPS), Part 3: Method of specifying the performance and test requirements, edition 3.0 (performance classification VFI-SS-11, output waveform class S at total harmonic distortion of 8% or less under linear and reference nonlinear load, dynamic output performance classes 1, 2 and 3). Current, stability date 2026. Paywalled. https://webstore.iec.ch/en/publication/60140
- IEC 61000-4-30:2025, Electromagnetic compatibility (EMC), Part 4-30: Testing and measurement techniques, Power quality measurement methods, edition 4.0 (class A basic measurement interval of 10 cycles at 50 hertz or 12 cycles at 60 hertz, dip and swell detection on half-cycle RMS). https://webstore.iec.ch/en/publication/71611
- IEEE Std 1459-2025, IEEE Standard Definitions for the Measurement of Electric Power Quantities Under Sinusoidal, Nonsinusoidal, Balanced, or Unbalanced Conditions (RMS current squared equals fundamental current squared plus harmonic current squared, with fundamental active and reactive components in quadrature). Supersedes IEEE Std 1459-2010, clause unchanged in substance. https://standards.ieee.org/ieee/1459/7578/
- Uptime Institute. Tier Standard: Topology (Tier III concurrently maintainable with redundant distribution paths, Tier IV fault tolerant with independent and physically isolated systems). No edition year stated on the Uptime Institute page. https://uptimeinstitute.com/tiers
- IEEE Std 1100-2005, IEEE Recommended Practice for Powering and Grounding Electronic Equipment, Table 3-3 (stray currents and common-mode noise in the equipment grounding conductor and on data cables as a cause of random data errors or slow transfer, particularly in analog-based rather than digital-based systems, check for stray current above 1 to 2 amperes) and 6.4.1.1.5 (neutral current from phase imbalance and nonlinear supplies raising neutral-to-ground potential and common-mode noise). Inactive-Reserved since 2021-03-25. Cited as a historical record, not as a current standard. https://standards.ieee.org/ieee/1100/3055/
- Tuladhar, L. R. and Banerjee, K. Impact of the Penetration of Inverter-Based Systems on Grid Protection. CIGRE US National Committee, 2019 Grid of the Future Symposium (inverter fault current 1.1 to 1.5 times rated output current). https://cigre-usnc.org/wp-content/uploads/2019/10/2D_3.pdf
- 3DFS. Software-Defined Electricity: Optimized Electrification, Chapter 1 (Kirchhoff’s current law and neutral current from unbalanced phases, nanosecond measurement, parallel installation without interrupting power, power factor, harmonic, phase balance and impedance correction, real-time phase balancing). Company white paper. First-party. https://3dfs.com/sde-whitepaper
- 3DFS. VectorQ Technical Overview, Installation and Application Notes, current revision (VectorQ2 208 volt, up to 60 kW, 9 kVAR, 50 A per phase. VectorQ5 480 volt, up to 120 kW, 60 kVAR, 60 A per phase. No 415 volt or 400 volt rating listed, custom voltages on request. Voltage tolerance plus or minus 15%, frequency tolerance plus or minus 0.5%. Sensing under 10 nanoseconds, correction under 5 microseconds. Harmonic measurement to the 53rd order and correction to the 23rd. Neutral current reduced to near zero by active phase balancing. 1,000 or more samples per sine wave. Heat dissipation under 2.4 kW and under 3.6 kW at full load. Connection by a three-line, neutral and ground cable in parallel to the network. Multiple units in parallel. A unit corrects to its rated output and the remainder passes uncorrected. Overload behavior current-limited. Not compatible with RCD or GFCI devices. Touch current 3.5 mA AC. CE conformity assessment per IEC 62477-1, UL compliance by field evaluation. Indoor, IP20, minus 5 to plus 42 degrees Celsius, 85% humidity, 1,000 m altitude, EMC Class A. Manufactured in Pittsboro, North Carolina with global components. The electrical system continues to operate as before if the controller is removed or powered down. Page 11: fully autonomous from first power-on, no laptop, software or external configuration required for commissioning). With the R034 VectorQ data sheet (internet dependency none, operates autonomously, Ethernet 10/100Base-T network interface, Modbus TCP/IP). Product documents. First-party.
- 3DFS. SDE Technical Training Document (response-time comparison: SDE under 100 microseconds, active harmonic filter 1 to 10 milliseconds, capacitor banks 1 to 3 seconds, automatic voltage regulator 1 to 10 seconds. Correction current equals the negative of the harmonic, reactive and imbalance components). Internal document. First-party.
- 3DFS. Products page (VectorQ2 and VectorQ5 in production, parallel connection at the panel, outside the current path, installation without interrupting the circuit, live record of power quality at the panel, pilot starts with an on-site network analysis against the facility’s baseline), SDE Summary page (the controller logs each correction), Resilience page (no internet dependency and no cloud latency) and Press and Case Studies page (the customer account). 3DFS website. First-party. /products, /technology/sde-summary, /technology/resilience and /press-proof
- 3DFS. Electrical network analysis of server racks at a data center, redacted field report, summary values (VectorQ2a in parallel on two server racks fed from a UPS through a distribution panel at about 120 volts per phase, about 2.6 and 1.6 kilowatts, installed in about 20 minutes without interrupting power, readings by the controller’s own instrumentation. At the controller connection: rack 1 current THD 6.4 to 1.9%, power factor 0.931 to 0.999, total current 23.8 to 22.6 amperes summed over three phases, per-phase I²R sum 205.2 to 185.8 on a 1 ohm reference, phase power spread minus 1.00, minus 39.06 and plus 40.06% to plus 1.35, minus 0.93 and minus 0.42%. Rack 2 current THD 13.2 to 3.6%, power factor 0.831 to 0.995, total current 15.9 to 13.8 amperes, per-phase I²R sum 91.3 to 73.3, phase spread plus 38.65, plus 11.20 and minus 49.85% to minus 0.64, plus 1.52 and minus 0.88%. Voltage THD 0.58 and 0.48%, unchanged. Corrected active power at the connection 57 and 70 watts above uncorrected, controller consumption 38.7 and 31.9 watts, load active power up 18 and 38 watts). Redacted site assessment. First-party.
- Roberts, D. Vox, 2018-06-20, URL dated 2018-06-05 (the chief executive of the American division of Freudenberg’s information technology company on a test in the company’s data center: power consumption dropped about 20%, server temperature about 20 degrees, checked against his own UPS displays by switching the unit off and on). Customer account, not an instrumented measurement. https://www.vox.com/energy-and-environment/2018/6/5/17373314/electricity-technology-efficiency-software-waste-3dfs
- 3DFS. Field observation of network switch packet error rate on server racks under correction, site and date withheld (a small and consistent drop in packet error rate with correction on, read from the site’s own switch counters, no rate or comparison count in the record). Unpublished field observation. First-party.
- UK Ministry of Defence. Sanctuary Awards 2020, Highly Commended, Energy, Low Carbon and Resource Efficiency: The Defence Innovation Software Defined Electricity Project, published 2021-03-16 (trials in 2020-02 at the 3DFS facility in North Carolina, funded by the Defence Innovation Unit, with Underwriters Laboratories as independent third party. The entry states the technology had not been industrially deployed at any scale and names the MOD as the only external organisation to have tested the technology). GOV.UK. https://www.gov.uk/government/publications/mods-sanctuary-awards-winners-2020/full-list-of-the-sanctuary-award-winners-2020
- Army Technology, 2021-04-01, reprint of the Brite Innovation Review interview with Lt Cdr Jonathan Parker, UK MOD Defence Innovation Unit (correcting at the last load does not propagate back up the network). https://www.army-technology.com/features/current-challenges-how-ai-enabled-power-distribution-could-prevent-losses/
- 3DFS. The Capacity Already in the Wires: Grid Reliability in the Fast Timescales, Technical Companion, section 8 (SDE does not synthesize inertia, is not a UPS and not a generator, satisfies no reliability standard on its own, and no U.S. national laboratory has characterized the figures). First-party. Listed on the Press and Case Studies page.
- Wired Insider, branded content produced by Wired Brand Lab on behalf of Deloitte. A Green Future Depends on the Security and Cyber Resilience of Renewable Technologies, 2021-09-28 (Sharon Chand of Deloitte Risk and Financial Advisory: software-defined electricity will increase the cyber risk profile of companies that adopt it and can also provide value through data analytics and increased cyber resiliency, and it can directly be used to increase cyber resilience by aligning the data it collects to help companies identify threats virtually undetectable through other sources. The piece does not name 3DFS). https://www.wired.com/sponsored/story/a-green-future-depends-on-the-security-and-cyber-resilience-of-renewable-technologies/
- Power Efficiency Gains by Deploying 415 VAC Power Distribution in North American Data Centers, 2011-09-22, pages 5 and 6 (the 415 VAC distribution used in much of the world outside North America gaining a foothold in the U.S. and Canada, 240 volts to rack equipment, PDU transformer eliminated). Vendor white paper. https://cdn10.servertech.com/assets/documents/documents/63/original/415VAC_Power_Distribution_Dec14.pdf
- Meta Llama Team. The Llama 3 Herd of Models. arXiv:2407.21783, 2024, section 3.3 (a single straggler slowing thousands of other GPUs). Preprint. https://arxiv.org/abs/2407.21783
- IEA. Key Questions on Energy and AI, April 2026, published 2026-04-16, executive summary (global data center electricity consumption roughly doubling from 485 terawatt-hours in 2025 to 950 terawatt-hours in 2030). https://www.iea.org/reports/key-questions-on-energy-and-ai/executive-summary
- A leading GPU maker’s rack-scale system user guide, hardware section, undated, read 2026-10-02 (rack power consumption approximately 120 kilowatts). Manufacturer documentation. https://docs.nvidia.com/dgx/dgxgb200-user-guide/hardware.html
- Uptime Institute. Annual Outage Analysis 2024, published 2024-03-27 (54% of operators said their most recent significant outage cost more than 100,000 dollars and 16% more than 1 million dollars, 2023 survey, power the most common cause of serious outages). https://intelligence.uptimeinstitute.com/resource/annual-outage-analysis-2024
- Ingarra, N. Understanding the Thermodynamics of Alternating Current. In Compliance Magazine, 2026-10-30. Discussion of current demand, component sizing and thermal behavior in an inverter and motor system. The author reports higher DC input current at lower input voltage under a constant-power load and expects increased Joule heating. https://incompliancemag.com/understanding-the-thermodynamics-of-alternating-current/
Version 3.4