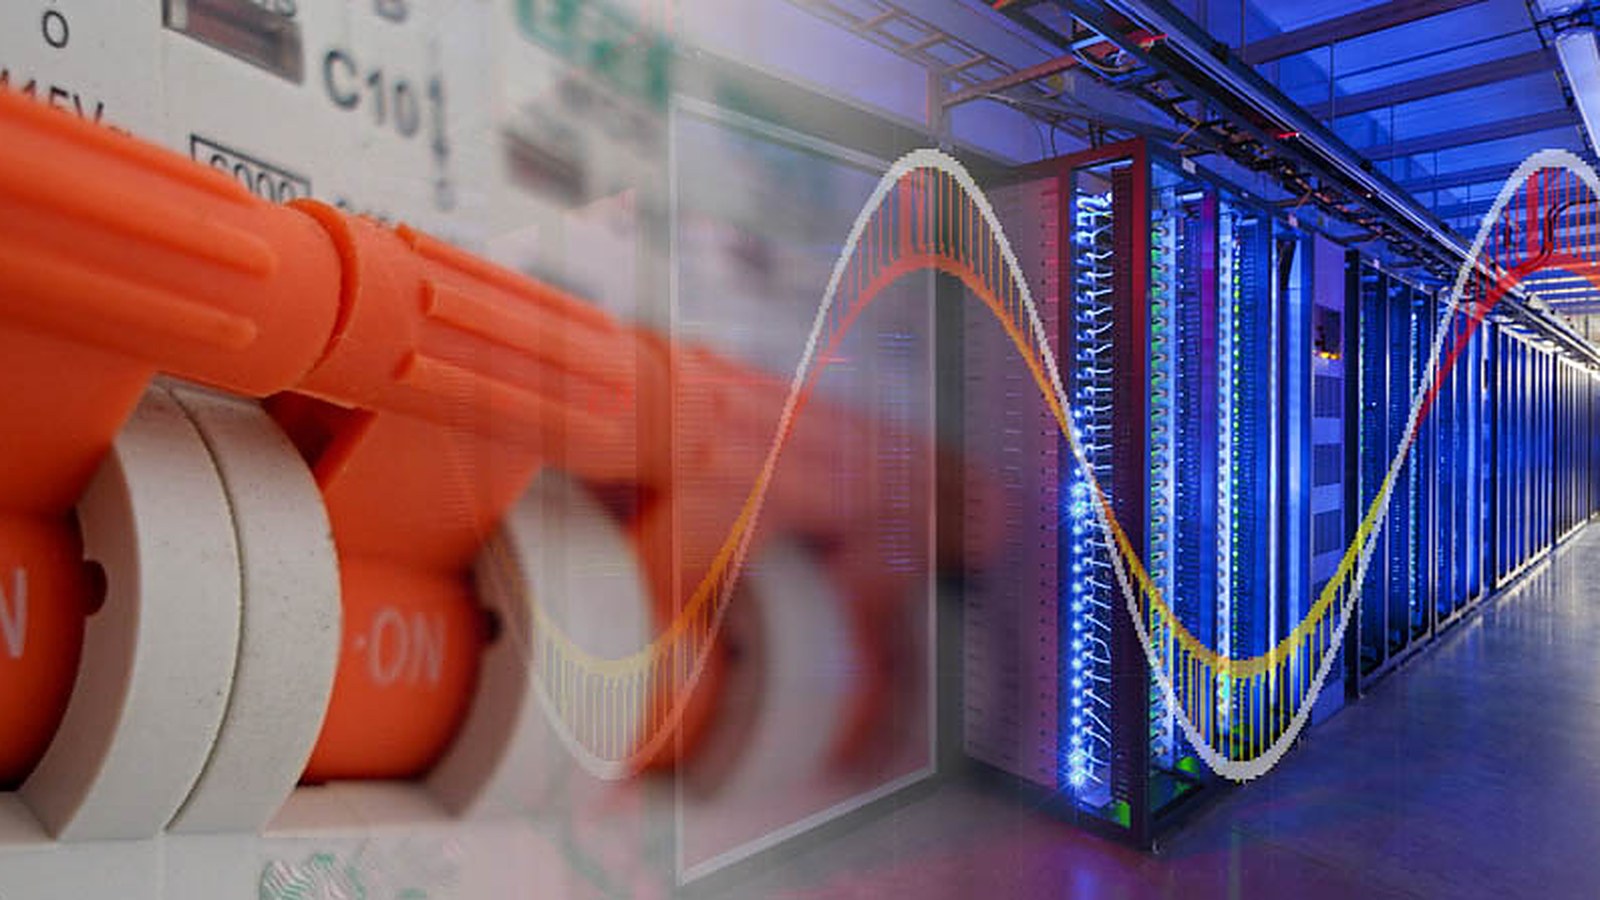
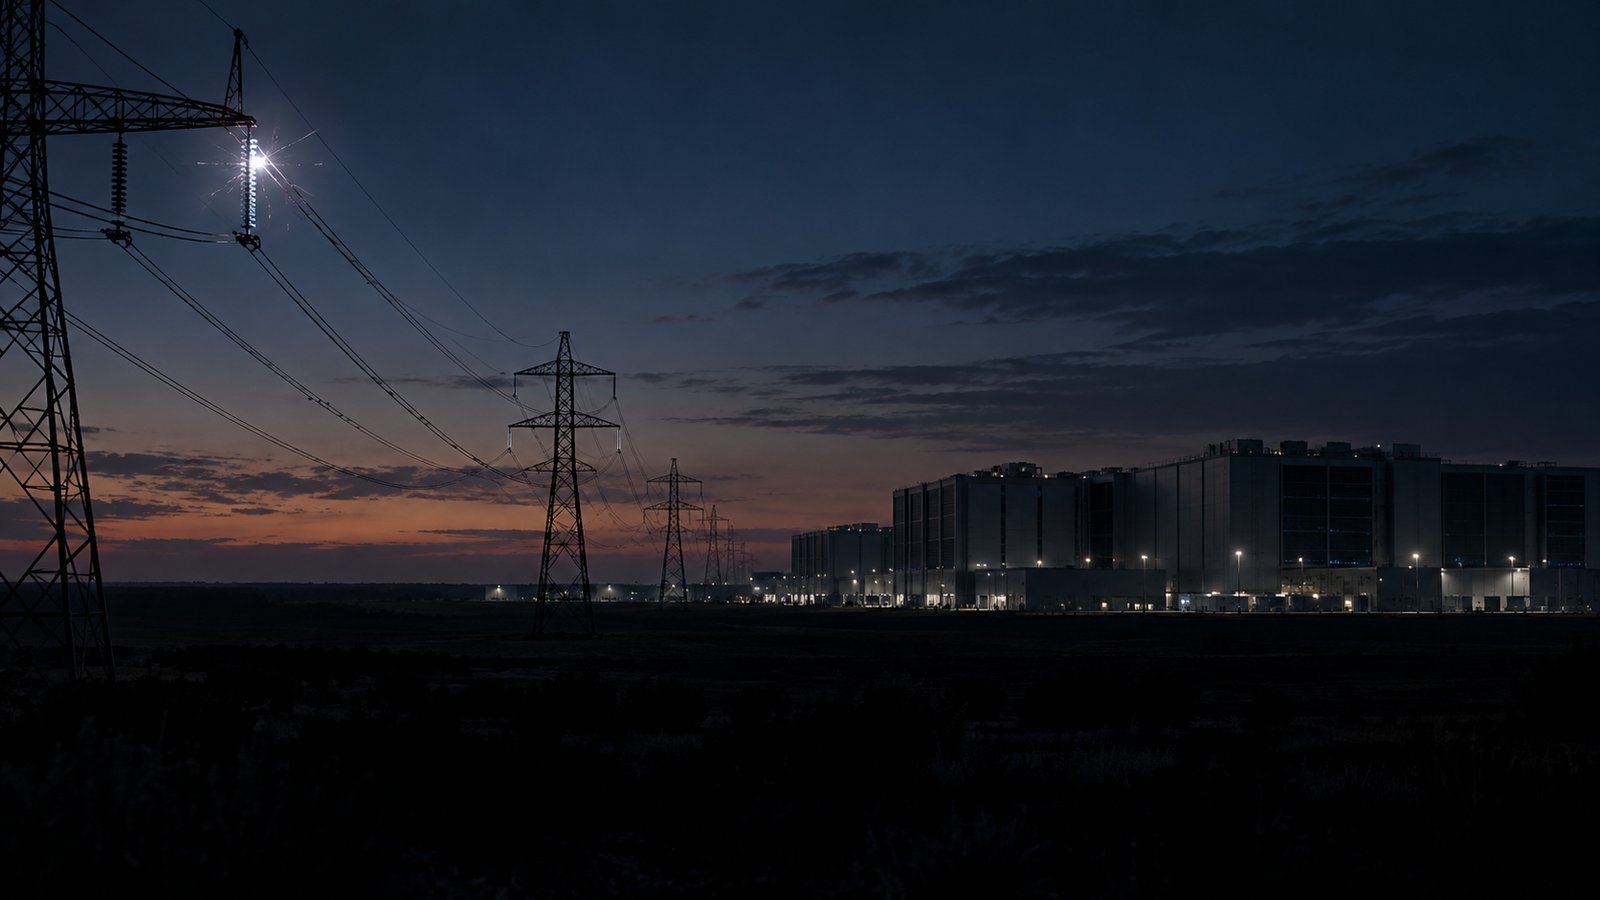

This video, published on our YouTube channel on June 11, 2026, runs about six minutes. Its title names sub-cycle oscillations. According to the description, it starts from a July 2024 event in which about 1,500 MW of data center load left the grid. It also cites an alert from the North American Electric Reliability Corporation (NERC), which the description calls only the third Level 3 alert in NERC’s history. The video says it explains why, and what the grid cannot see.
What it covers
The description names three subjects. It gives no chapter times and does not state the video’s conclusions.
- The July 2024 event. About 1,500 MW of data center load leaving the grid.
- The NERC alert. The Level 3 alert, in the description’s account only the third in NERC’s history.
- What the grid cannot see. The video’s explanation of what is hidden from the grid.
The description also points to our whitepaper, The Capacity Already in the Wires. The alert and its count are the video’s statements, not ours.
Editor’s note. The video’s description says the load disconnected “in 82 seconds”. NERC’s incident review describes the event differently. A failed lightning arrester caused six faults on one 230 kV line in an 82-second period, each lasting 42 to 66 ms. The data centers’ own protection moved about 1,500 MW of load to backup power, and about 1,260 MW of it dropped at the third fault and stayed off for hours.
Why it matters
Our Voltage Stability page records the same July 2024 event. About 1,500 MW of data center load transferred to backup power on its own protection when a failed lightning arrester faulted a 230 kV line. Our Resilience page cites the same NERC incident review.
The Voltage Stability page also shows how an averaged reading can hide a short event. A 30% sag lasting two cycles inside a 10-minute window moves the average by 0.0017%. So the 10-minute value reads 99.998% of nominal while a half-cycle detector reads 70%.
The video is our own, so its account states our case. One limit applies to ours. The controller corrects current at the panel, and a deep sag from the utility side stays with stored energy. Start with a one-week measurement at one panel.
Where this stands today
- Voltage Stability: why a voltage reading points back to a current, and what a ten-minute average hides
- Resilience: why a short sag costs a plant restarts and lost hours before any outage is counted
- Data Centers and Compute: the electrical load of a data hall and where more capacity can and cannot come from