
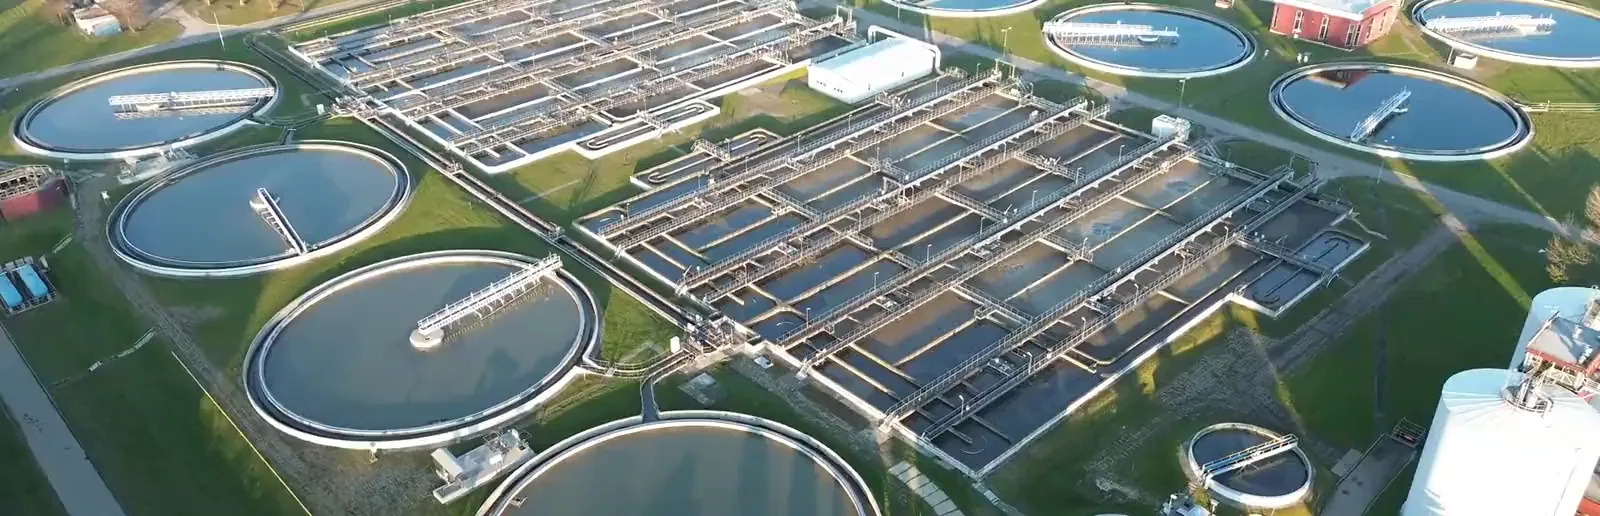
A treatment plant runs pumps and blowers on motor control centers. At part load they draw lagging, distorted and unbalanced current, so the motors run hot and the bill grows. We correct that current at the panel and record what the pumps drew when the bus fell. Energy often makes up 25 to 30% of a water utility’s operation and maintenance cost 50.
Executive summary
The source feeding each pump panel carries working current from the corrected loads. The controller does not keep a pump running through a sag and does not reduce a motor’s starting current. Pilots start with a network analysis measured against the plant’s own baseline 41,43,48.
- Drives. Pumps and blowers on six-pulse drives. The drives’ main harmonic currents are supplied at the panel, so those orders no longer cross the transformer or the generator 1,41.
- The power bill. Utility power factor clauses. With the reactive share supplied at the panel, the meter sees the working power and the controller’s own draw 41. The tariff and the plant’s own meter data set the value.
- Uneven phases. Single-phase and unequal loads on one panel. The controller moves the difference between phases at the panel. This reduces the unbalance the panel’s own loads create, to within 20% of the average by rating 1,37,41.
- On generator. The standby set the permit requires. Inside the controller’s voltage and frequency range the panel presents balanced current to the generator, and motor starting still sizes the set 1,41.
A treatment plant is a building full of motors. Pumps move the water. Blowers push air into the tanks. Mixers and presses handle the sludge.
Most of the large motors run on electronic drives. The rest start across the line or through a soft starter.
Every drive draws its current in pulses, and the pulses land on the motor control center as distortion. Every motor on a starter draws current out of step with the voltage. The utility bills for the difference. Uneven loads leave the three phases unequal. The motors fed straight from the bus run hotter for the imbalance.
This is the Consumption pillar. Nonlinear loads distort the waveform, and a plant is full of them. When the utility fails, the permit requires the pumps to keep running on a generator, the weakest source the plant owns.
Power quality promises are not new. Most came with a brochure and no measurement. This page carries the measurements and names who made them.
Software-Defined Electricity (SDE) works at the panel where the loads sit. The VectorQ controller connects in parallel at a motor control center or a lift station panel. It corrects the current of the loads on that panel in millionths of a second.
The problem
The load. A treatment plant is a motor load on 480 volt motor control centers 44. Pumps, blowers, mixers and dewatering drives run on six-pulse variable frequency drives or on motor starters 44. A starter runs the motor across the line or through a soft starter 15.
Pumping is the largest energy use at a water plant, and aeration takes about half of a wastewater plant’s energy 23. EPA puts the aeration share at 25 to as much as 60%, and two reviews put the aerobic stage at 50 to 60% 21,22,24. Pumping runs 55 to 90% of electricity use at a drinking water utility 25.
Lift stations sit on their own services at the far end of long feeders. The loads on those panels are drives and motors. Their current is the problem this page measures.
Signs the electricity in a plant is uncontrolled. An operator has seen each of these. Each has a paragraph below, with its number and its source.
- A motor control center whose voltage reads distorted on the analyzer while the drives run.
- A power factor on the same center that sits far below what the tariff wants.
- A pump motor on the bus that runs hotter than its nameplate says it should.
- A drive that faults on a dip and comes back on its restart timer, and nobody can say what the dip was.
- A capacitor fuse that blows or a relay that trips for no reason anyone has named.
- A generator that hunts on the same drives the utility carried without complaint.
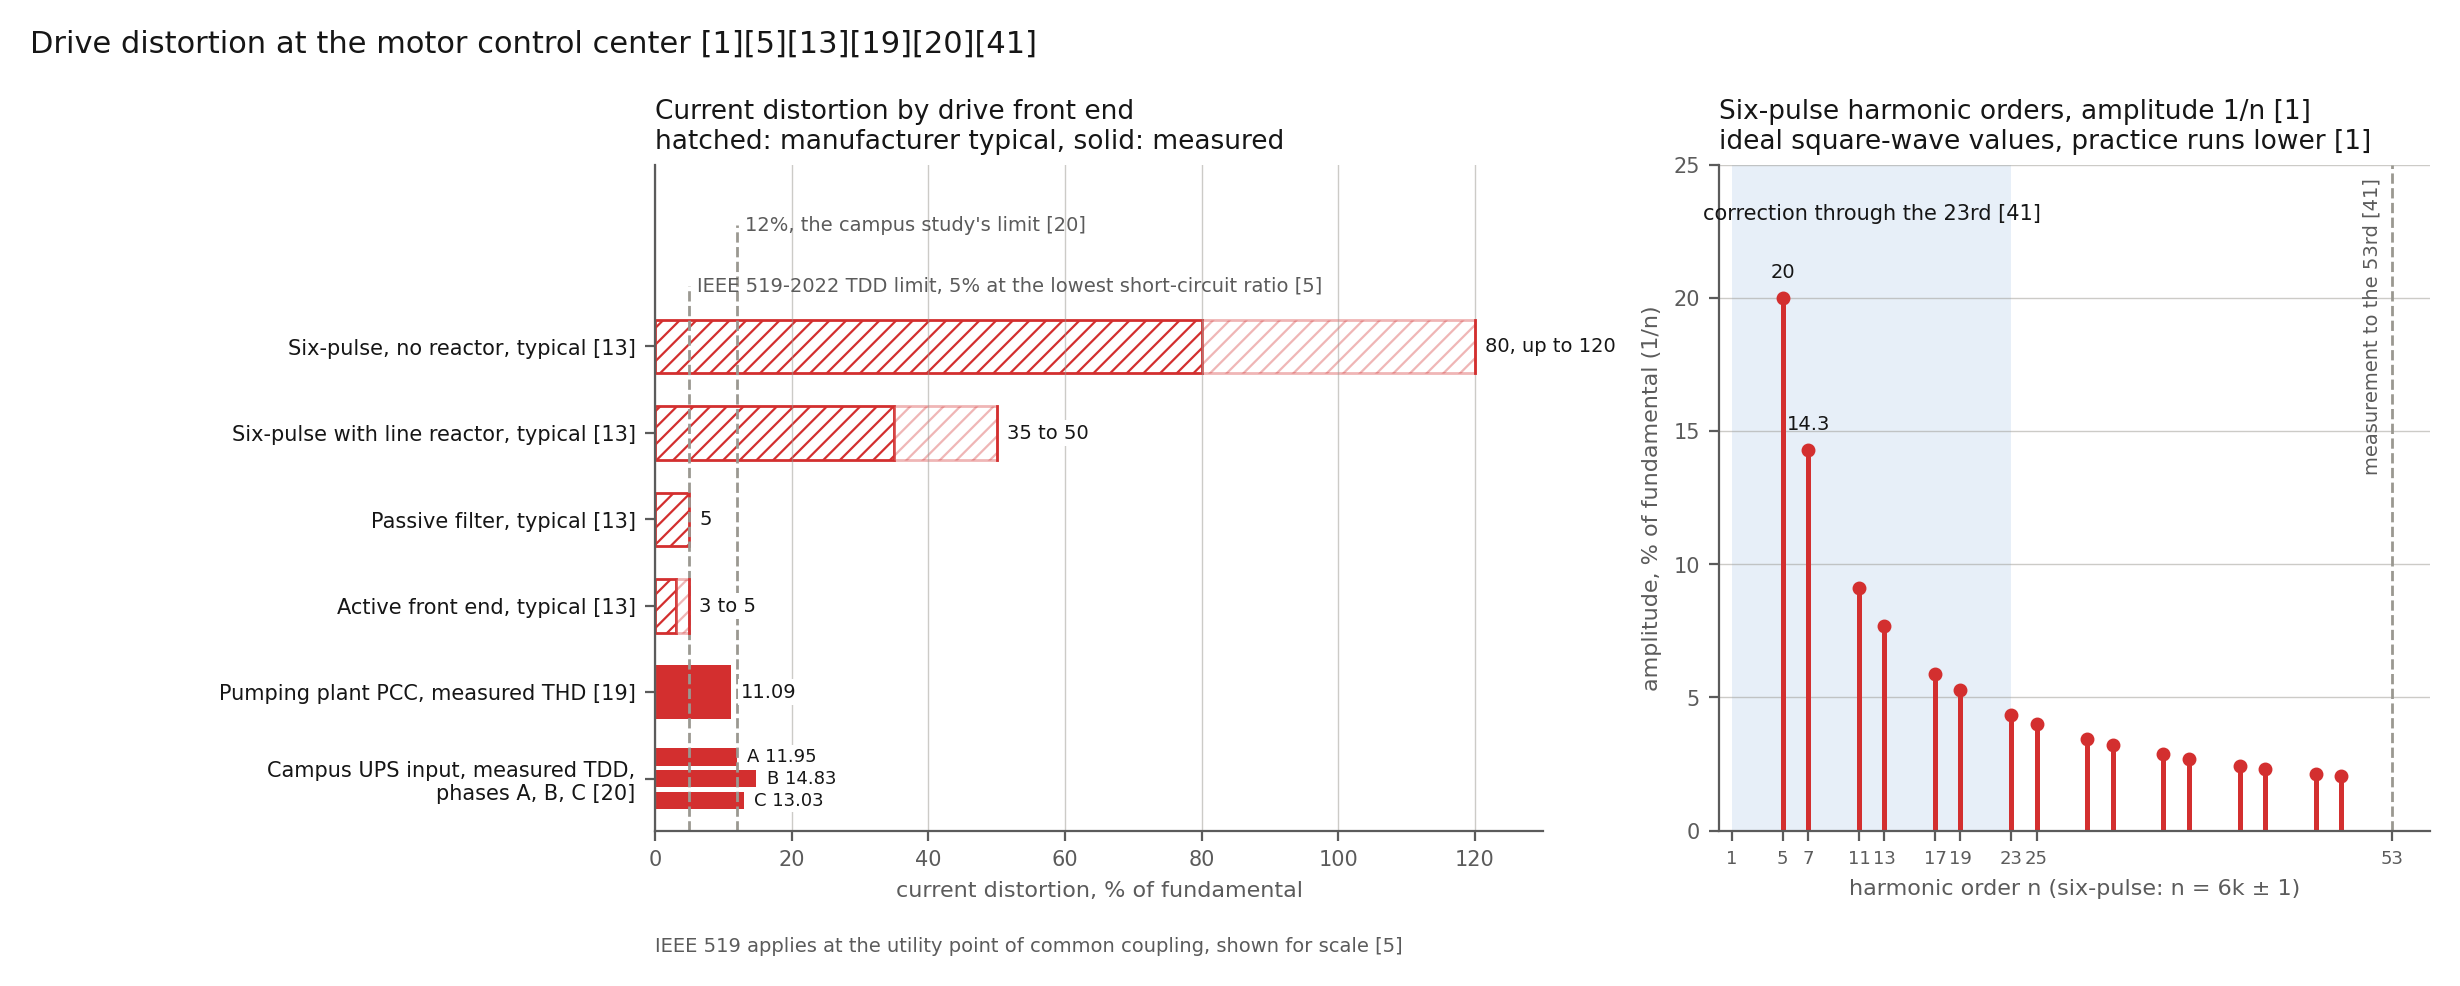
The rule. A static power converter draws harmonic currents of order n = kp ± 1, where p is the pulse number 1,14. A six-pulse drive draws the 5th, 7th, 11th, 13th, 17th, 19th, 23rd and 25th 1. A twelve-pulse drive removes the 5th and 7th and draws the 11th, 13th, 23rd and 25th 1. The theoretical amplitude of each order is the fundamental divided by the order, 20% at the 5th and 14.3% at the 7th 1. Practice runs lower because of system impedance 1.
A drive with no internal impedance draws about 80% current distortion at its terminals, up to 120% 13. A line reactor or DC choke brings the figure to 35 to 50% 13. A passive filter reaches 5% and an active front end 3 to 5% 13.
A drive rectifies the incoming AC to DC, then inverts the DC back to AC at an adjustable frequency 1. The DC bus separates the two sides. The motor control center sees the rectifier’s current. The motor sees the inverter’s output. Harmonic current through the source impedance makes harmonic voltage, E = I × Z, and the distortion is higher on a high-impedance source 1.
The measurements. A 2023 study of a pumping plant found the 5th, 7th and 11th orders dominant, the product of six-pulse drives 19. Current distortion at the point of common coupling was 11.09% and the power factor 0.846 19. The drives raised current harmonics by 10% 19. The plant pumps cooling water at an industrial site, not a municipal plant 19.
A 2024 campus study with drive-fed chilled water pumps in its load measured 11.95 to 14.83% total demand distortion at a UPS connection, over a 12% limit 20. Total demand distortion is referenced to the maximum demand current, and current distortion to the fundamental 5. The two agree at full load and diverge at light load 5.
A third-party consulting engineer measured a water plant with a calibrated power quality analyzer 44. On a 480 volt motor control center feeding backwash, booster and sludge pumps and air compressors, voltage distortion ran between 7 and 10% 44. Over a 2 hour 39 minute trend, power factor averaged about 0.72, as low as 0.22 and as high as 0.83 44. The analyzer’s power factor includes the distortion the drives draw, so the displacement power factor a reactive meter bills sits higher 36.
The analyzer logged 32 voltage dips in the same window 44. Average line voltage ran 458 to 467 volts, and 447 to 457 volts in the first snapshot 44. ANSI C84.1 Range A service voltage at 480 volts runs 456 to 504 volts 4. Motors draw more current and run hotter under low voltage 1.
The limits. IEEE 519-2022 sets 8% total and 5% per harmonic for voltage on buses of 1 kilovolt and below 5. For current the standard sets 5 to 20% total demand distortion by the ratio of short-circuit to load current 5. TM 5-689 recommends a harmonic study once harmonic-producing sources reach 20% of the plant load 1. IEEE 3002.8 describes the study practice 49.
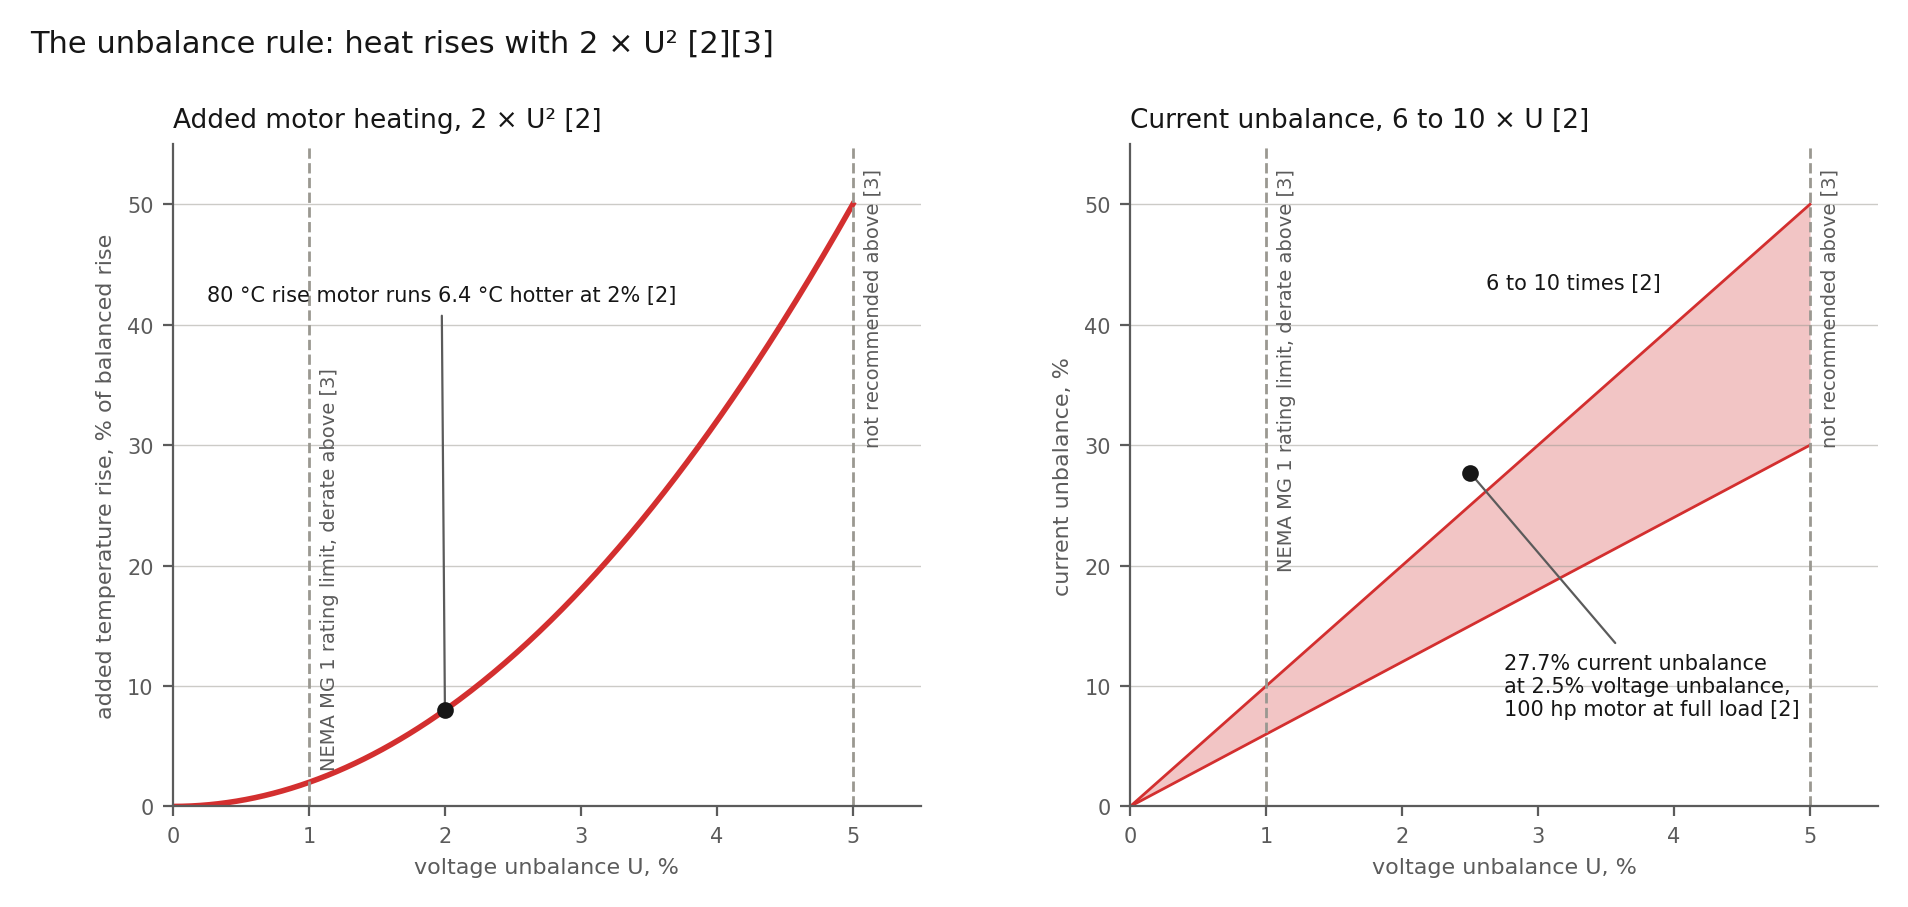
The motor’s heat. Motors are linear loads, and a motor on distorted voltage draws harmonic current 1. The harmonic current heats the laminations and the windings, and the motor overheats unless derated 1. The literature puts the temperature rise from harmonics at about 4 to 6 degrees Celsius 17. Unbalance adds a second term for a motor fed straight from the bus.
Percent voltage unbalance is 100 times the largest deviation of a line voltage from the average, divided by the average 2. The Department of Energy’s motor tip sheet draws on NEMA MG 1 2. The sheet puts the total temperature rise at the balanced rise times 1 + 2 × (percent unbalance)² / 100 2. A motor with an 80 degree Celsius rise runs 6.4 degrees hotter at 2% unbalance 2.
Current unbalance runs 6 to 10 times the voltage unbalance 2. A 100 horsepower motor at 2.5% voltage unbalance ran 27.7% current unbalance at full load, and its efficiency fell from 94.4 to 93.0% 2.
NEMA MG 1 rates a polyphase motor for 1% unbalance at the terminals and requires derating above 1% 2,3. NEMA does not recommend operation above 5% 3. Each 10 degree Celsius rise halves winding insulation life 2,18. A drive-fed motor sees the inverter, not the bus. Supply unbalance reaches such a motor as ripple on the DC bus and as unequal rectifier current on the line side.
Where unbalance comes from. The tip sheet lists six causes 2. Unevenly distributed single-phase loads and faulty power factor correction equipment sit inside the fence 2. An unbalanced or unstable utility supply, an unbalanced transformer bank, an open primary conductor and a single-phase ground fault sit outside 2.
Unbalanced current through the source impedance makes unbalanced voltage, E = I × Z for each phase 1,37. A 2022 study of four-wire networks records voltage asymmetry growing worse where the short-circuit impedance is high 37. ANSI C84.1 asks supply systems to hold unbalance to 3% 4. The motor tolerates 1% 3.
Take an illustrative 480 volt lift station panel reading 478, 481 and 466 volts. The average is 475 and the largest deviation is 9 volts. The unbalance is 1.9% 2. The added temperature rise on a line-fed pump motor is 2 × 1.9², or 7.2%, and the current unbalance runs 11 to 19% 2.
Now take the load-driven share, on an illustrative 0.15 ohm source: a small transformer at the end of a long feeder. A 20 ampere negative-sequence current from the panel’s own loads makes 3 volts of unbalance across the source, 1.1% of 277 volts 1. The same current through a 750 kilovolt-ampere plant transformer at 5.75% impedance, 0.018 ohms, makes 0.36 volts, 0.13% 1.
The share the panel’s own loads create is large on a weak service and small on a stiff one. The arithmetic is linear and illustrative. The network analysis measures the two shares at each panel.
Path one, today: utility, generator, transfer switch, motor control centers, drives, soft starters, capacitors and SCADA
Most plants run this way today and will for years. A utility service feeds 480 volt switchboards through an automatic transfer switch, and a standby generator feeds the other side 44. TM 5-689 holds the switch to one sixth of a second or less 1.
Motor control centers feed the process: drives behind line reactors for the high service pumps, starters for the rest 44. Capacitor banks trim the power factor for the tariff 1,24. SCADA (supervisory control and data acquisition) stages the pumps and restarts them after an event.
Ten States Standards require emergency pumping capability at a pumping station unless adequate storage prevents overflow 26. The standard accepts a connection to two independent utility substations, an engine-driven generator or pump on site or portable, or portable pumping 26. The objective is to prevent the discharge of raw or partially treated wastewater 26.
The permit. A National Pollutant Discharge Elimination System (NPDES) permit defines bypass as the intentional diversion of waste streams from any portion of a treatment facility 27. The permittee’s defense fails if adequate back-up equipment should have been installed in the exercise of reasonable engineering judgment 27. An upset excludes noncompliance caused by lack of preventive maintenance or improperly designed facilities 27. Any noncompliance which endangers health or the environment is reported within 24 hours 27.
The record. On 2011-09-08 a regional power outage stopped a San Diego pump station 28. The backup released about 1.9 million gallons of untreated sewage into a creek, a lagoon and the ocean 28. In Escondido, a failure of the influent pump station’s UPS stopped the influent pump and released 180,700 gallons 29.
On 2020-12-25 three breakers tripped inside the switchgear of a Long Beach water reclamation plant 30. The trips cut power to the influent pump station, the SCADA system and the phones 30. The investigation traced the trips to a switchboard controller backplane 30. Power was lost at about 6:26 p.m., the overflow stopped at about 11:01 p.m., and 222,542 gallons reached a channel 30. The liability was 410,126 dollars 30.
Across 25 states from 2001 to 2003, EPA attributed 48% of sanitary sewer overflows with a known cause to blockages and 26% to wet weather 31. Mechanical or power failures, combined in one category, took 11% 31. All three records make the same point: the pumps stopped when the bus fell, whatever took the bus down.
The controller changes none of those three sequences. It loses power with the bus and does not ride through an interruption. It does not replace the UPS, the switchgear controls or the generator.
On a corrected panel the controller logs each correction 43. Where the unit retains its log through a power loss, the log is the plant’s record of the load current up to the moment the bus fell. We confirm the retention before a pilot.
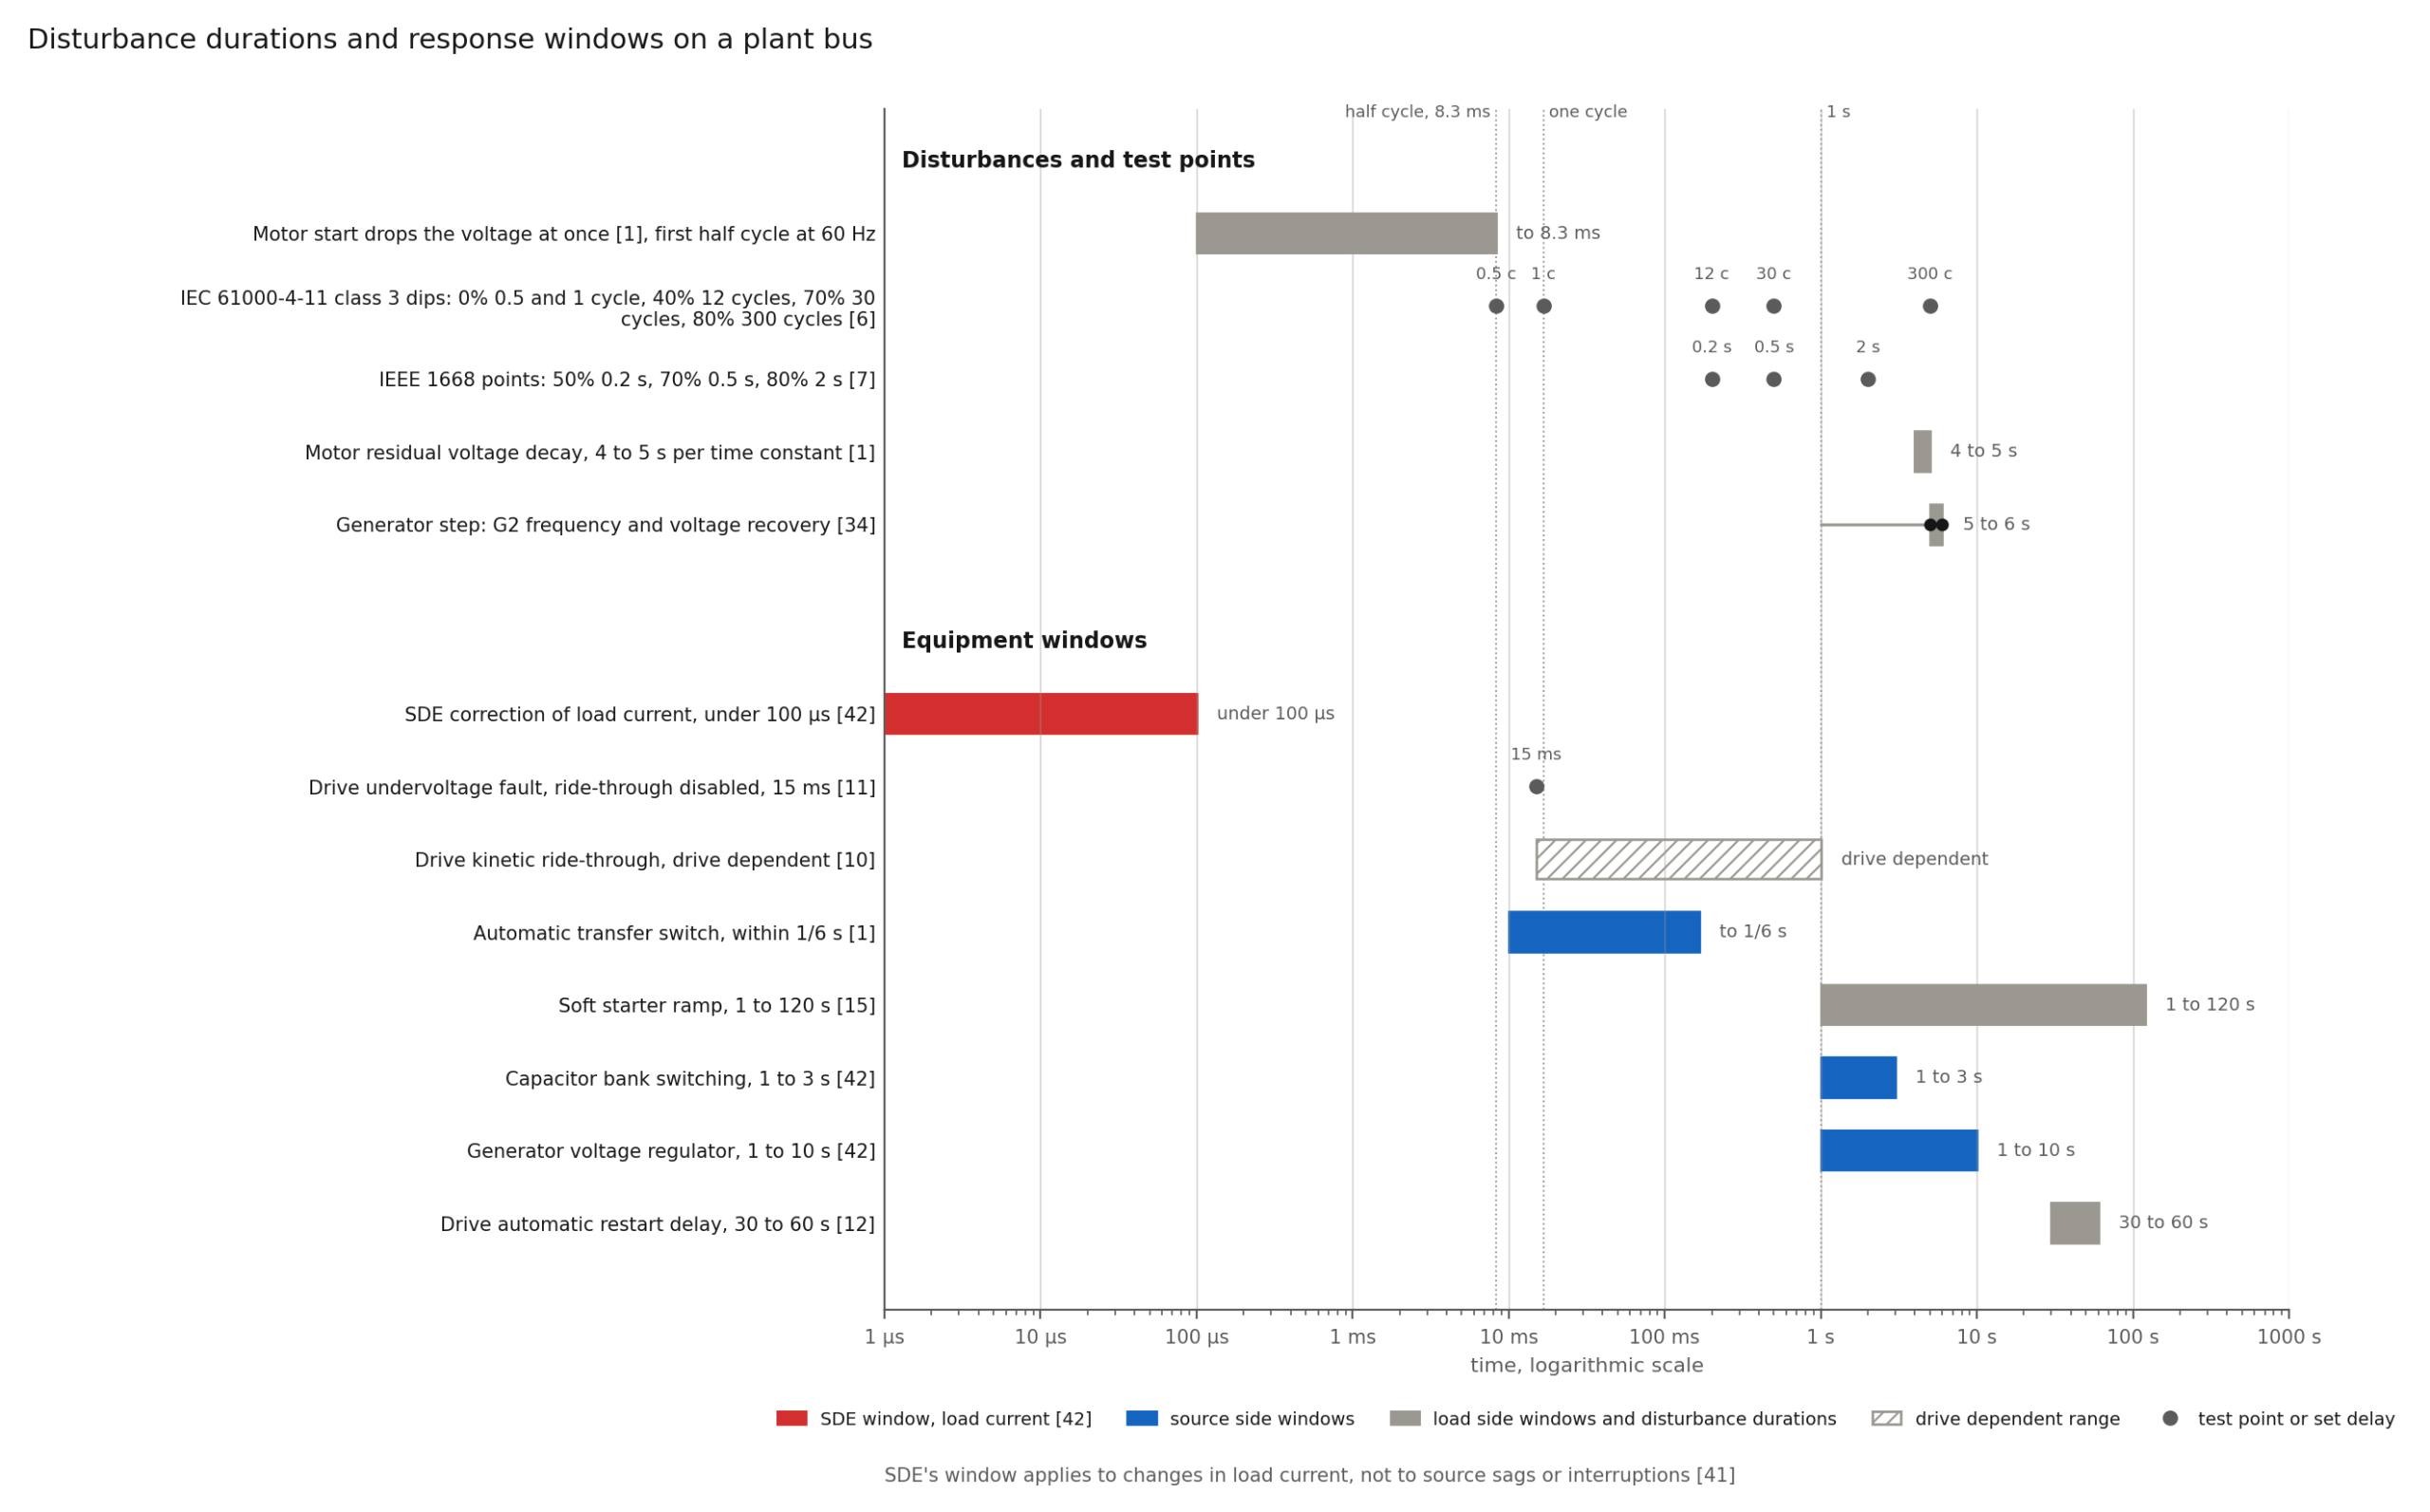
The sag. A motor start drops the voltage for a short period, and line voltage regulation takes a definite period to recover 1. Much electronic equipment shuts down and stays down if the voltage drops below a limit for more than a few milliseconds 1. Motor torque falls with the square of terminal voltage 3,15. A motor starting at 80% voltage has 64% of its starting torque, and at 50% voltage 25% 15.
The drives set the trip. One drive maker’s manual says that a drive keeps running through a mains dropout until the DC link falls to its stop level. The level typically sits 15% below the lowest rated supply voltage 9. For a 380 to 480 volt unit the level sits near 323 volts, about 67% of 480 volts, by the arithmetic above 9.
A second maker’s drive with ride-through disabled faults on undervoltage if power is not restored within 15 milliseconds 11. Another maker’s drive rides through a supply loss on the kinetic energy of the rotating motor 10. Drives with automatic restart typically wait 30 to 60 seconds for the circuit to stabilize before restarting 12.
IEC 61000-4-11 tests equipment up to 16 amperes per phase 6. Its class 3 dips run 40% voltage for 10 or 12 cycles, 70% for 25 or 30 cycles and 80% for 250 or 300 cycles 6. IEEE 1668-2017 tests end-use equipment under 1,000 volts at 50, 70 and 80% 7. The ITI curve covers 120 volt information technology equipment and not a 480 volt motor 8.
The band and the sag. The controller is rated for plus or minus 15% on voltage and plus or minus 0.5% on frequency 41. On a 480 volt bus the band runs 408 to 552 volts. Every sag test point above sits below 408 volts 6,7.
That maker’s stop level also sits below 408 volts 9. Inside its band the controller corrects the load current. The controller does not hold the voltage the source delivers and does not keep a pump running through a sag 48.
For a sag inside the band, the correction changes one term 1. The term is the reactive and harmonic share of the I × Z drop the corrected loads add on the plant’s own impedance 1. A motor start is mostly reactive current far above the controller’s 60 amperes, so in a motor-start sag the term is small 41. We confirm the controller’s behavior below 408 volts in the site network analysis. The drive’s ride-through setting, the transfer switch, the generator and the SCADA restart logic decide whether the pumps stay on.
Motor starting. A stalled motor draws about six times its running current, and a controller design ratio of ten times is common 1. NEMA puts locked-rotor current at 600 to 700% of full load 16.
Take an illustrative 100 horsepower pump on a 480 volt panel with a full-load current of 120 amperes. Across the line the start draws 720 to 840 amperes 16. A soft starter holds the start near 3 to 4 times rated current, 360 to 480 amperes 15. The trade-off is torque, which falls with the square of the voltage 15.
The controller does not reduce a motor’s starting current, which is the motor’s own. Within its rating, the controller supplies the reactive share of the current on the panel. A VectorQ5 supplies at most 60 amperes per phase 41. On a start of this size the controller runs at its limit, and the rest passes uncorrected 41. The start belongs to the motor, the soft starter, the drive’s current limit and the motor-starting study 49.
Reconnecting a spinning motor out of phase draws 25 to 35% more inrush than a normal start 1. TM 5-689 puts the stresses at 156 to 183% above normal 1. A large centrifugal pump holds its residual voltage for 4 to 5 seconds per time constant, and capacitors on the same bus lengthen the decay 1. In-phase monitors on the transfer switch handle the reconnection 1.
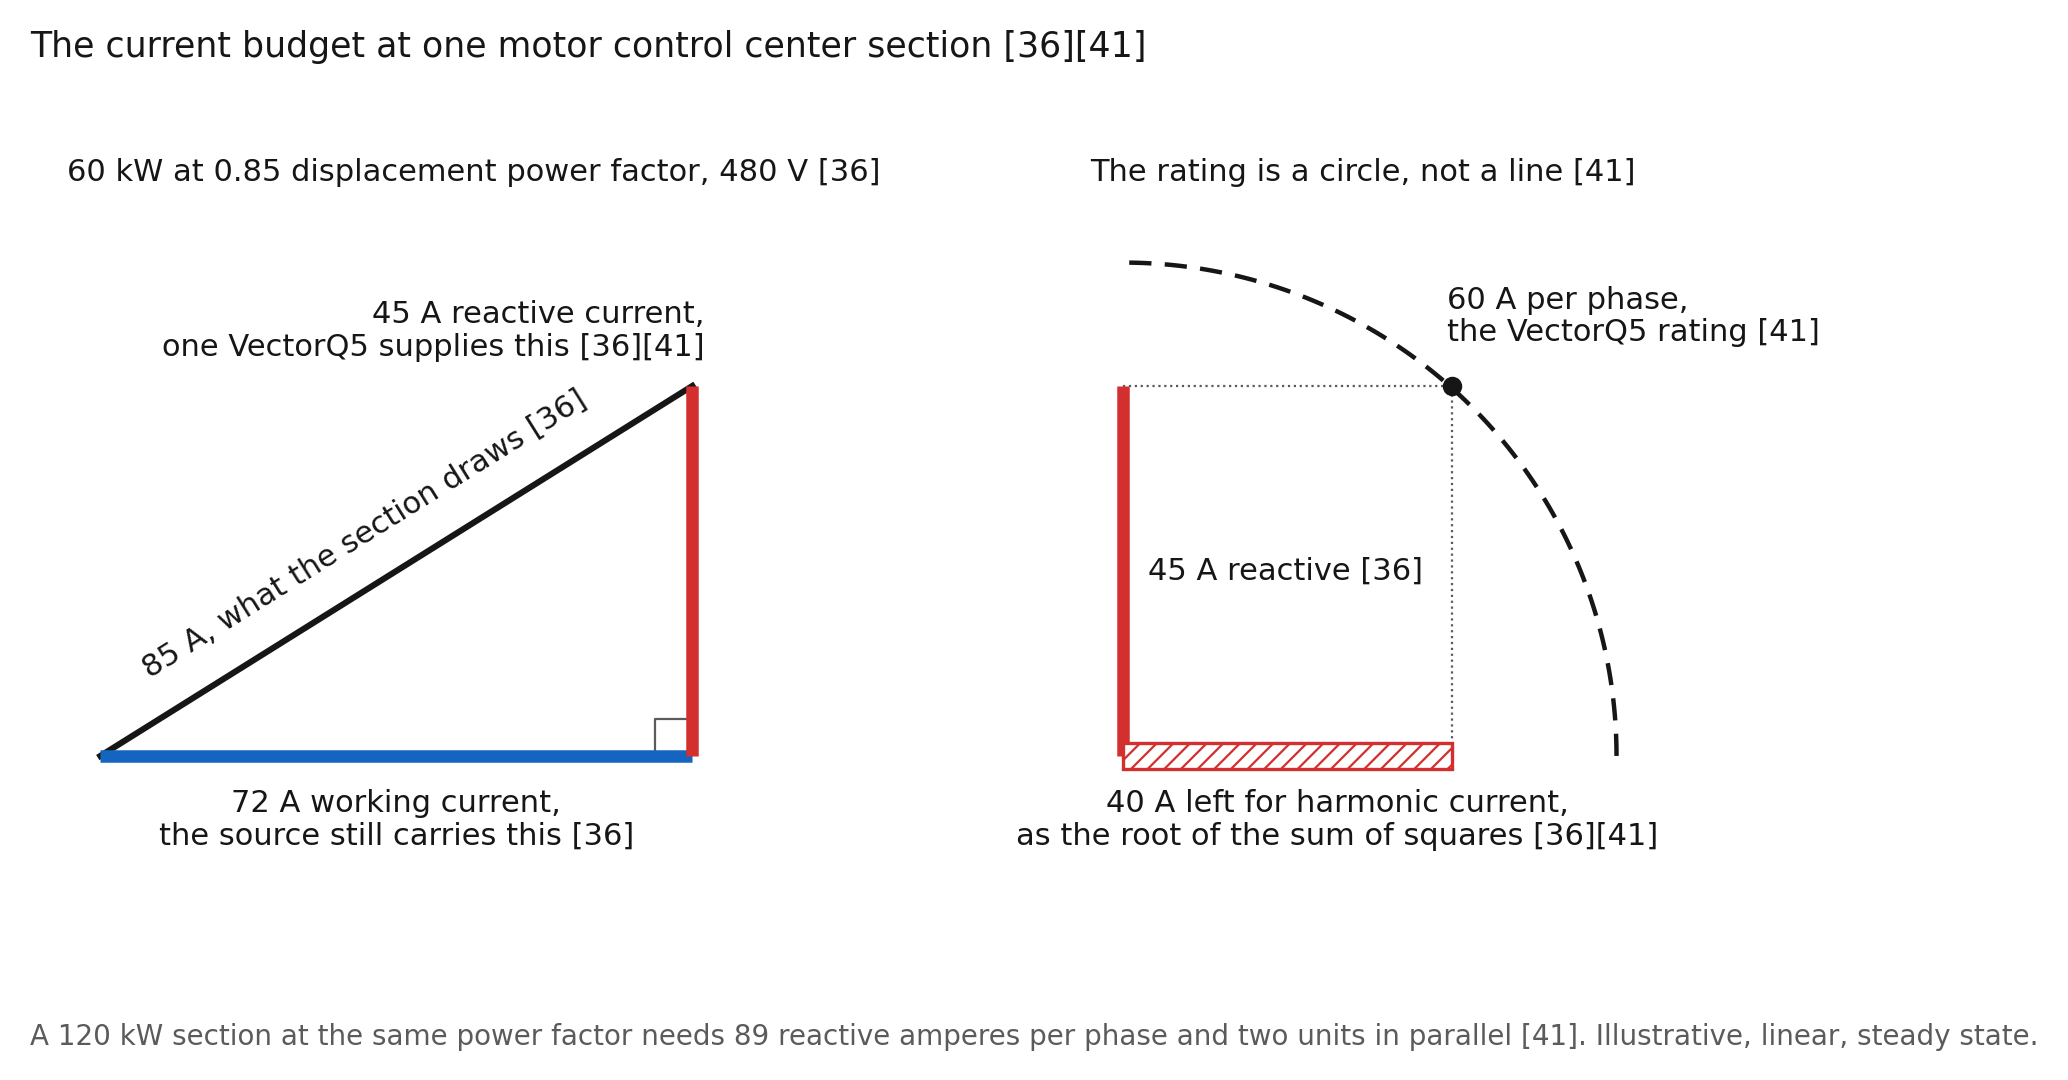
What the controller does cover. Take an illustrative motor control center section of starter-fed motors and drives running 60 kilowatts at displacement power factor 0.85 on 480 volts. The section draws 85 amperes per phase 36. Of those, 72 amperes do work and 45 amperes are reactive 36.
One VectorQ5 supplies the 45 amperes per phase, inside its 60 ampere rating 41. Harmonic current from the section’s drives shares the same budget, as a root sum of squares, so 40 amperes remain 36,41. The utility transformer or the generator then carries 72 amperes per phase from those loads, plus the controller’s own draw 41. A 120 kilowatt section at the same power factor needs 89 reactive amperes per phase and two units in parallel 41. The arithmetic is linear, illustrative and steady state.
Our bench test on a refrigerated container’s compressor, a 460 volt motor load, points the same way as the arithmetic 45. At the connection, power factor rose from 0.82 to 1.00, reactive power fell from 4,852 to 488 volt-amperes reactive, and average current from 9.93 to 8.25 amperes 45. Active power at the connection ran 6,992 watts uncorrected and 7,066 watts corrected, with the controller’s draw inside the reading 45. The test supports no energy-saving claim.
Capacitor banks. Plants carry fixed or switched capacitors for the utility’s power factor clause 1,24. EPA calls capacitors at an induction motor perhaps the most cost-effective correction of power factor 24. A capacitor bank is analog compensation: a fixed part chosen for one load and one source, which cannot follow the load from cycle to cycle.
TM 5-689 records what followed when banks met converters: harmonic voltages and currents affecting the capacitors and other equipment 1. Source inductance resonates with the bank at a frequency one of the plant’s harmonic sources excites, and the harmonics are amplified and no longer source limited 1.
The parallel resonance order is the square root of the short-circuit megavolt-amperes divided by the bank’s megavolt-amperes reactive 1. Take an illustrative 750 kilovolt-ampere transformer at 5.75% impedance, about 13 megavolt-amperes short circuit, and a 300 kilovolt-ampere-reactive bank. The resonance lands at the 6.6th order, between the 5th and 7th of every six-pulse drive on the bus 1. Fuse operation, capacitor failure, unexplained relay tripping and overheating follow 1. TM 5-689 advises keeping capacitors off the line on a generator until operation with nonlinear loads has been observed 1.
A bank on a corrected panel is a coordination question, not a benefit. The controller’s current transformers sit on the panel’s incoming conductors, so a bank downstream reads as load current 41. Our specification, R034B, states that a second capacitor bank or active filter on an installation requires the coordination to be re-engineered, to avoid resonance and control conflicts 41. The network analysis records the bank, its switching steps and any detuning reactor, and decides whether the bank stays. We do not promise the bank comes out.
The generator. A standby generator has 5 to 100 times the sub-transient reactance of the utility transformer 1. Nonlinear loads working fine on utility power react entirely differently on a generator 1.
Generators are usually rated at 0.8 power factor, and harmonic currents add kilovolt-amperes reactive 1. Harmonic currents heat the stator core and induce currents in the rotor pole faces 1. TM 5-689 records regulators, governors and paralleling controls that count zero crossings. Harmonics add crossings, so speed and frequency control hunt 1.
Large motor starts swing the generator’s frequency 1. ISO 8528-5 allows a class G2 set a 10% transient frequency drop and a 20% voltage drop on a load step 34. The standard allows 5 and 6 seconds for recovery 34. Those swings pass outside the controller’s 0.5% frequency band for seconds 34,41.
A set on droop at part load sits outside the band with no step at all 41. R034B does not state the controller’s behavior outside the band. We confirm the behavior across a generator step in the site network analysis, on the generator, before a pilot.
Three-phase motors on the same bus damp harmonics and absorb the energy as heat 1. The generator keeps its harmonic sizing, because removing the controller returns the harmonics 1,41.
Where the controller connects. The VectorQ controller connects in parallel on a 480 volt motor control center bus or a 480 volt lift station panel with a VectorQ5 41,43. On a 208Y/120 volt panel the VectorQ2 takes the same position 41,43. The connection runs through the controller’s own breaker, with a three-phase, neutral and ground cable 41.
R034B specifies a 50 ampere dedicated breaker, and the figure is under revision against the VectorQ5’s 60 ampere per phase rating 41. The conductor, the overcurrent device and the arc-flash label follow the electrical code and the plant’s coordination study. The installation follows the plant’s de-energized work practice.
The utility or the generator feeds the motor control center directly through the transfer switch, so correction there reaches the source at all times, on both paths. On a drive, the correction sees the rectifier’s current on the line side. The motor’s own current and the drive’s output stay on the far side of the DC bus 1. On a soft-started or across-the-line motor, the motor’s running current lands on the panel directly. The controller supplies its reactive and unbalanced share within rating 41.
What the controller corrects. Correction runs through the 23rd harmonic 41. The range covers the 5th, 7th, 11th, 13th, 17th, 19th and 23rd of the six-pulse drives, and the 11th, 13th and 23rd of twelve-pulse drives 1,41. On a 208Y/120 volt panel the range covers the 3rd, 9th, 15th and 21st of single-phase loads 41. The 25th and higher orders pass uncorrected, and the controller measures them to the 53rd 41.
The correction is digital. The controller computes the harmonic, reactive and unbalanced components of the current it measures and supplies their negative. It works from measurement, not from a tuned part.
The drive’s switching frequency, selectable from 1 to 16 kilohertz on one drive line, sits on the motor side of the DC bus 9. The rectifier sets what the motor control center sees at the low orders 1. Switching-frequency emission on the line side belongs to the drive’s electromagnetic compatibility (EMC) filter, outside the correction range 41.
Coverage. One controller corrects one panel. Correction at a load does not propagate back up the network 47. Coverage scales with controller count and rating, sized to each panel.
The VectorQ2 is rated for 208 volt panels up to 60 kilowatts and 9 kilovolt-amperes reactive at 50 amperes per phase 41. The VectorQ5 covers 480 volt panels up to 120 kilowatts and 60 kilovolt-amperes reactive at 60 amperes per phase 41.
On the VectorQ5 the ampere rating binds: 60 amperes at 277 volts per phase is 50 kilovolt-amperes reactive 36,41. On the VectorQ2 the reactive rating binds: 9 kilovolt-amperes reactive at 120 volts is 25 amperes per phase 36,41. The supplied current transformers are rated to 200 amperes per phase, and larger feeds take custom transformers 41. Multiple units run in parallel with no master and no communication between units, each correcting the conditions at its own connection point 41. We confirm the sharing on the feed in the network analysis before a second unit goes in.
R034B lists no rating above 480 volts 41. A 4,160 volt pump motor or blower sits outside the product line until a rating is published. R034B lists three-phase with neutral for both models and requires the neutral and ground connected 41. A 480 volt delta, corner-grounded or ungrounded system carries no neutral and sits outside the document until a rating is published 41.
Our Products page lists detection of one, two or three phases at 120 to 240 volts for the VectorQ2 43. A lift station on a single-phase or open-delta service is a custom application until R034B carries the rating and we confirm the fit.
Path two, the future: active front ends, more drives, solar and storage on the plant bus, and blackstart
The drives. Plants add drives to more pumps and blowers for the affinity-law saving, which belongs to the drive and the process, not to the controller 23. Correction through the 23rd order covers the residual low orders of every front end on the panel. The higher orders stay with the drive’s own filter 41.
Solar, storage and cogeneration. Biogas from sludge digesters burns to make electricity, and each million gallons per day of flow yields about 26 kilowatts 23. EPA lists on-site renewable generation among the options for a plant 23.
EPA’s 2023 resilience guide records a wastewater plant with a 5 megawatt solar array, a 500 kilovolt-ampere battery and a microgrid for extended outages 25. The same guide records a 3.2 megawatt cogeneration plant sized to sustain full plant operations 25. A 30 megawatt microgrid supports a water treatment plant in Houston, and a plant in Rialto islands for at least three days 25.
Those sources sit on the plant bus. An inverter delivers about 1.1 to 1.5 times its rated current into a fault, while a synchronous generator delivers about six times for several cycles 39,40. Real power, reactive support and harmonic current for the loads on the same bus draw on one current budget 36. During Hurricane Sandy, many generators failed after 24 to 48 hours for want of exercise and maintenance 25.
Blackstart. A 2026 review of distribution blackstart with renewable sources names water and wastewater treatment plants among the critical loads energized first, under limited supply 38. Industrial demand carries induction motors with tighter voltage tolerance and sizable starting currents 38. Cold load pickup begins with a brief inrush from transformer remagnetization and motor starting, with a substantial reactive power demand 38. The inrush forces inverters into current limiting and reduces the headroom left for frequency support 38.
Uneven phase loading creates localized voltage violations after reconfiguration 38. Protection’s own failure modes, a missed fault and a false trip, are most acute on long, high-impedance laterals 38. A lift station is such a lateral.
SDE’s role on this path. Take a panel fed from the plant bus. While the island holds the controller’s voltage and frequency band, the corrected loads’ reactive, harmonic and unbalanced current stays at the panel 41. The battery inverter, the solar inverter and the cogeneration alternator carry the working current. The inverter’s budget goes to real power and to the fault current the protection needs 39.
On a blackstart pickup the sequence matters. R034B describes a diagnostic of about three minutes at power-on and states correction begins immediately 41. We confirm which holds before a pilot. Until then, correction returns after the controller’s power-on sequence that follows a bus loss. The pickup runs inside that window.
The start itself, its inrush and its torque stay with the motor and the source 38. The controller does not form the island, dispatch the sources, hold frequency, supply real power, store energy, provide fault current or replace the microgrid controller.

Why SDE is critical on both paths
Most power quality equipment reacts to a voltage symptom after it has formed, in seconds. A capacitor bank switches, a regulator settles and the current that made the symptom keeps flowing. Software-Defined Electricity starts from the current instead. It measures the full three-phase waveform at nanosecond resolution and corrects the current waveform digitally, at the load, in microseconds 41,42. The VectorQ controller samples the waveform 1,000 or more times per cycle 41.
The controller connects in parallel at the panel and sits outside the current path 43. It runs continuously, and removing or powering down the controller leaves the panel as installed 41. The effects below hold with the source inside the controller’s band 41.
The rule. The 5th, 7th, 11th and 13th of every six-pulse drive on the panel sit inside the correction range, with the 17th, 19th and 23rd 1,41. Supplied at the panel, those orders no longer cross the transformer or the generator from the corrected loads. Harmonic voltage is harmonic current times source impedance, so the distortion on the bus falls with the harmonic current the source carries 1. Motors on the bus draw harmonic current from the distorted voltage, so the harmonic heat in the line-fed motors falls with the distortion 1,17. The background distortion the utility delivers stays, as with unbalance 1. Harmonic currents heat transformer and generator cores, and transformers loaded under 70% have shut down on over-temperature 1. Root-mean-square (RMS) current squared equals the fundamental squared plus the harmonic squared, so every harmonic ampere heats without working 36. The drives keep their line reactors, which limit the rectifier’s own current 13.
Phase balance. The controller transfers the difference between phases at the panel and holds the source current within 20% of average by rating 41. Balancing removes the share of voltage unbalance the panel’s own single-phase and unequal loads create, the I × Z share, above the 20% residual 1,37,41. On a 208Y/120 volt panel with single-phase loads the share is the whole story. The share the utility delivers comes down the line, and the controller leaves the utility’s share in place 2,4. A motor on a corrected panel still draws 6 to 10 times the remaining voltage unbalance as current unbalance 2.
The utility’s share. Take a panel where a line-fed motor is the largest load. The motor’s own unbalanced current partly cancels the utility’s unbalance across the source impedance. Balancing the source current removes the cancellation. On a stiff plant bus the change is a few percent of the utility share. On a weak source the utility share at the motor’s terminals rises toward the full line value. Phase balancing at the panel is the wrong tool for the utility’s share. The terminal unbalance on such a motor depends on both shares. We measure the terminal unbalance with correction on and off in the network analysis before a pilot.
The bill. Apparent power equals real power divided by power factor, S = P / PF 36. Take an illustrative 100 kilowatt load at 0.72 power factor, the average the water treatment facility study measured on a motor control center 36,44. The load draws 139 kilovolt-amperes and 96 kilovolt-amperes reactive 36. Below 90% power factor, Xcel Energy multiplies billing demand by 90% divided by the power factor 33. Under Xcel Energy’s formula the 100 kilowatts bill as 125 kilowatts of demand 33. Under Georgia Power’s schedule, where the company elects to meter reactive demand once power factor falls below 95%, 63 kilovolt-amperes reactive sit above one third of the kilowatts 32. At 0.42 dollars each the excess bills 26 dollars in the month 32. The study’s 0.72 includes the drives’ distortion 44. The transformer carries the distortion, but a reactive meter does not bill for it. So the billed figures on such a bus sit below the arithmetic 36. We state no dollar saving without the tariff and the plant’s own meter data.
Rating and heat. For the corrected loads, the transformer, the feeder and the generator carry working current 36. Conduction loss falls with the square of current 1. In the illustrative 60 kilowatt example the source current falls from 85 to 72 amperes per phase. The feeder’s conduction loss falls 28% for those loads, tens of watts on a short feeder. The controller’s own losses land on the same panel. They are rated under 600 watts typical and up to 3.6 kilowatts at full correction on a VectorQ5 41. The differences between the bench rows imply 263 to 342 watts 45. Inside the fence the net in this example is a loss. The reduction in current lands on the utility transformer, the feeder and the generator. We claim no net heat saving without the site’s data. The motor’s heat stands on its own chain. The correction reaches the motor only through the voltage at its terminals.
The generator. Inside the controller’s band, the corrected panel presents balanced fundamental current to whichever source holds the bus 41. Harmonic currents no longer add zero crossings for the controls TM 5-689 describes 1. The harmonic share of the kilovolt-amperes reactive on the alternator goes away for those loads 1. The engine still sets the kilowatt ceiling, and motor starting still sizes the set 1.
Speed. A motor start drops the voltage at once 1. A half cycle at 60 hertz is 8.3 milliseconds. A transfer switch has one sixth of a second, a capacitor bank 1 to 3 seconds and a generator regulator seconds 1,34,42. The controller responds to a change in load current in under 100 microseconds 42. A pump staging on, a drive shifting its harmonics or a phase dropping its load is such a change.
Protection. True-RMS sensing meters, relays and trip units read distorted current correctly, and average-sensing meters read pulsed current as much as 50% low 1. The feeder and main breakers upstream of the corrected panel see lower RMS current, with harmonics and reactive current removed. Branch breakers and motor overloads on the panel see the same current as before. The controller’s breaker and fault contribution enter the coordination study like any other panel device 41. The controller is not compatible with residual-current or GFCI devices on its branch, and its touch current is limited to 3.5 milliamperes AC 41. Large 480Y/277 volt services carry ground-fault protection of equipment on the main under the electrical code. A service ground-fault relay sums the four conductors at the main. It picks up at a setting far above the milliampere trip of the residual-current devices R034B excludes 41. We answer whether the service relay affects a shunt device on a downstream panel with the plant’s one-line, before a pilot.
Listing, environment and interfaces. The controller holds CE conformity assessment per IEC 62477-1, and each installation carries a UL field evaluation 41. The controller is an indoor IP20 unit rated for minus 5 to plus 42 degrees Celsius, 85% humidity and 1,000 meters altitude, with Class A EMC 41. The controller carries no hazardous-location rating 41. A pad-mounted lift station or a wet well needs a conditioned enclosure outside the classified area 41. The enclosure holds the unit above minus 5 degrees Celsius through the winter and gives it the same hydrogen sulfide protection as the station’s other electronics 41. The site’s drawings set the boundary. The controller runs with no internet dependency and no cloud latency 43. The water treatment facility study used a prototype with a reporting link to our headquarters 44. The production unit’s network interface enters the plant’s segmentation like any other panel device.
Observability. Class A power quality meters compute magnitudes over 10 or 12 cycles, about 200 milliseconds, and detect dips at half-cycle resolution 35. A permit reports noncompliance within 24 hours and a written report within 5 days 27. The controller measures the current under correction and logs each correction at the panel 43. SCADA shows the pumps’ state. The panel record shows the current the pumps drew through the event.
The record. Three records stand behind this page. The first is a third-party study. A consulting engineer measured a VectorQ2 prototype on a 208Y/120 volt panel at a water plant with a calibrated analyzer, over three days 44. The panel was lightly loaded at about 10 amperes per phase and fed from a 45 kilovolt-ampere transformer off the plant’s 480 volt distribution 44. At the panel feed, average power factor read 0.83 to 0.85 with the unit off and 0.95 to 0.96 with the unit on 44. In the final pair, phase currents read 9.4, 2.2 and 6.6 amperes with the unit off and 9.3, 7.0 and 8.3 amperes with the unit on 44. The spread across phases fell from 7.2 to 2.3 amperes 44. The sum of the phase currents was higher with the unit on, and the record does not separate a load change from the controller’s own current 44. The controller changes the current at the panel feed, not the current each load draws. The study’s narrative reports no active power reading for the panel pair, so the study supports no energy-saving claim. We do not use its percentage estimates 44.
The bench tests. The refrigerated container test on a compressor motor at 460 volts is the second record 45. The third is the 2020 bench, funded by the UK Ministry of Defence and verified by Underwriters Laboratories 46. The bench carried a three-phase test motor, a brake motor, a drive and capacitors 46. Its results and caveats sit on Press and Case Studies 43,46.

It sounds like a drive on one motor control center faults on a dip and SCADA restarts it. Nobody has named the cause. The open question is how the current at that panel is measured today.
We ship the VectorQ2 for 208 volt and the VectorQ5 for 480 volt networks, and both are in production 43. The network analysis sets controller count and rating 43.
Pilots start with an on-site electrical network analysis measured against the plant’s own baseline 43.
Start with a one-week measurement at one motor control center before specifying a controller. Send us the panel voltage and grounding, the drive and starter types on the panel, and the generator rating. Name any capacitor bank, passive filter or ground-fault protection on the service. Bring the tariff sheet and the worst motor’s history. We will reply with what we would measure and where.
Four PQ Components pages explain the mechanisms behind this page. Power Factor is the part-load pump and the kVA demand charge. Harmonics is the drive current at the motor control center. Voltage Stability is the sag that trips a pump and the generator that cannot catch it. Resilience says which clocks the plant’s own margins are counted on.
Sources
- U.S. Army. TM 5-689, ADP/Computer Electrical Installation and Inspection for Command, Control, Communications, Computer, Intelligence, Surveillance, and Reconnaissance (C4ISR) Facilities. Headquarters, Department of the Army, 2001-09-10. Paragraphs 3-2 a(3) (motor loads draw more current and run hotter under low voltage), 3-2 b(1) and (2) (sags from motor starting, regulation takes a definite period to recover, equipment shuts down below a limit for more than a few milliseconds), 5-1 (harmonic amplitude equals the fundamental divided by the order, 20 and 14.3%, practice lower because of system impedance), 5-2 and 5-2 a (harmonic sources, n = kp ± 1, six-pulse and twelve-pulse orders), 5-2 b (harmonic study at 20% harmonic-producing load), 5-3 c(1) (power factor capacitors applied to converters and the problems which followed), 5-4 a(2) and b (source inductance resonating with the power factor capacitor bank, harmonics amplified and not source limited, fuse operation, capacitor failure, relay tripping, overheating), 5-5 a (motors as linear loads), 5-5 b(4) (AC speed controls rectify to DC and invert back to adjustable-frequency AC), 5-7 c and d (transformers and generators under 70% shut down on over-temperature, motors on distorted voltage draw harmonic current and overheat unless derated), 5-8 a to c (zero crossings, hunting in speed and frequency control, load sharing), 5-9 a (E = I × Z, distortion higher on a high-impedance source), 5-12 a(2) and 5-13 d in the 2001 numbering (average-sensing meters read pulsed current as much as 50% low, true-RMS meters, relays and trip units), 6-4 b (generator frequency deviations from large motor starts), 6-4 d(4) (motor starting kVA capability), 6-4 f (5 to 100 times sub-transient reactance, nonlinear loads react entirely differently on a generator), 6-4 h and i (0.8 power factor rating, harmonic currents add kVARs, stator core and rotor pole face heating), 6-4 n, (1) and (2) (capacitor resonance caution on a generator, keep capacitors off the line, motors damp harmonics and absorb the energy as heat), 6-6 e (transfer switch operating time should not exceed one sixth of a second), 6-6 f(1)(b) (stalled rotor about six times running current, ten times as a controller design ratio, in-phase monitors), 6-6 h(2) (residual voltage time constants of 4 to 5 seconds for large motors), 6-6 j(1) (25 to 35% more inrush and 156 to 183% stresses out of phase) and 6-6 j(3)(d) and (h) (centrifugal pumps as high inertia loads, capacitors lengthen the open-circuit time constant). The WBDG URL serves the 2001 edition. The 2006 edition (28 April 2006, project file) renumbers chapter 5 from paragraph 5-10 onward by one and adds at 5-4 b the resonance order h = square root of short-circuit MVA divided by capacitor Mvar, citing IEEE 519-1992. The resonance order in the body is cited to the 2006 passage. https://www.wbdg.org/FFC/ARMYCOE/COETM/tm_5_689.pdf
- U.S. Department of Energy, Advanced Manufacturing Office. Motor Systems Tip Sheet 7, Eliminate Voltage Unbalance, DOE/GO-102012-3733, 2012-11 (percent voltage unbalance defined as 100 times the largest deviation from the average divided by the average, unbalances above 1% require derating per NEMA MG 1 Figure 20-2, six causes of unbalance, a 100 horsepower motor at 2.5% unbalance running 27.7% current unbalance with efficiency 94.4 to 93.0%, current unbalance 6 to 10 times the voltage unbalance, total temperature rise equals the balanced rise times 1 + 2 × (percent unbalance)² / 100 citing Reliance Electric 1998, an 80 degree Celsius rise motor running 6.4 degrees hotter at 2%, winding insulation life halved for each 10 degree Celsius increase). The tip sheet states its information is extracted from NEMA MG 1-2011. https://www.energy.gov/sites/prod/files/2014/04/f15/eliminate_voltage_unbalanced_motor_systemts7.pdf
- NEMA. ANSI/NEMA MG 1, Motors and Generators. Current edition MG 1-2024, paywalled. Free NEMA excerpt of MG 1-2016 Revised 2018, Part 12: clause 12.44.2 (torque approximately proportional to the square of the voltage) and clause 12.45 (polyphase motors rated for 1% voltage unbalance at the terminals, referring to 14.36). Clause 14.36 (effects of unbalanced voltages, definition at 14.36.2, derating figure) is not free. The 5% not-recommended limit as reproduced in a leading drive maker’s note Three-Phase Voltage Imbalances, LVD-EOTKN113U-EN. Derating curve values not asserted. https://www.nema.org/docs/default-source/standards-document-library/mg-1-part-12-watermark.pdf and https://library.e.abb.com/public/772bbffb5d6f41ffb88fc5d9da927dfd/LVD-EOTKN113U-EN_Three_Phase_Voltage_Imbalance_A.pdf
- ANSI C84.1-2020 (R2025), American National Standard for Electric Power Systems and Equipment, Voltage Ratings (60 Hertz). Reaffirmed 2025. Paywalled. Range A service voltage at 480Y/277 volts, 456 to 504 volts, and Range B service 440 to 508 volts, as reproduced by Pacific Power, Voltage Level and Range 1C.2.1, 2024-11-26. The 3% unbalance recommendation as reproduced by PG&E, Understanding Electric Power Characteristics, 2018-07. https://www.pacificpower.net/content/dam/pcorp/documents/en/pp-rmp/power-quality-standards/1C_2_1_PF.pdf and https://www.pge.com/assets/pge/docs/contact-us/report-an-issue/Understanding_Electric_Power.pdf
- IEEE Std 519-2022, IEEE Standard for Harmonic Control in Electric Power Systems. Table 1 (voltage distortion limits for buses of 1 kilovolt and below: 5.0% individual, 8.0% total) and Table 2 (current distortion limits for 120 volt through 69 kilovolt systems, total demand distortion 5.0 to 20.0% by short-circuit ratio, referenced to the maximum demand current). Active. Standard text paywalled. Values as reproduced by secondary sources. https://standards.ieee.org/ieee/519/10677/
- IEC 61000-4-11:2020, Electromagnetic compatibility (EMC), Part 4-11: Testing and measurement techniques, Voltage dips, short interruptions and voltage variations immunity tests for equipment with input current up to 16 A per phase, edition 3.0. Table 1, Class 3 test levels (0% for half a cycle and one cycle, 40% for 10 or 12 cycles, 70% for 25 or 30 cycles, 80% for 250 or 300 cycles). Paywalled, values as reproduced in the standard’s public preview. Equipment above 16 amperes per phase falls under IEC 61000-4-34:2005 with amendments 1 (2009) and 2 (2025), levels not asserted. https://cdn.standards.iteh.ai/samples/102366/465c32780e9d4ca0bf9edd5844e3c166/IEC-61000-4-11-2020.pdf and https://webstore.iec.ch/en/publication/89053
- IEEE Std 1668-2017, IEEE Recommended Practice for Voltage Sag and Short Interruption Ride-Through Testing for End-Use Electrical Equipment Rated Less than 1000 V. Active, replaced the 2014 trial-use version, revision project P1668 approved 2024-09-26. Paywalled. Test points of 50% for 0.2 seconds, 70% for 0.5 seconds and 80% for 2.0 seconds per a vendor summary, with the 50% point corroborated by a second vendor paper. https://standards.ieee.org/ieee/1668/6798/
- Information Technology Industry Council, Technical Committee 3. ITI (CBEMA) Curve Application Note, revised 2000. Scope: 120 volt nominal information technology equipment from 120, 208Y/120 and 120/240 volt systems. Sections 3.5 (sags to 80% for 10 seconds, 70% for 0.5 seconds) and 3.6 (dropout up to 20 milliseconds). https://www.itic.org/resources/Oct2000Curve-UPDATED.doc
- A leading drive maker’s design guide, AJ317025801074en-000101, 2019-09, section 6.2.4 Mains dropout (the drive keeps running until the DC-link voltage drops below the minimum stop level, typically 15% below the lowest rated supply voltage, with options trip lock, coast with flying start, kinetic back-up and controlled ramp-down), and the same drive series’ programming manual, parameter 14-01 Switching Frequency (1.0 to 16.0 kilohertz). The 323 volt and 67% figures in the body are our arithmetic on the guide’s statement. https://assets.danfoss.com/documents/272559/AJ317025801074en-000101.pdf and https://www.manualslib.com/manual/1636874/Danfoss-Vlt-Automationdrive-Fc-302.html?page=192
- A leading drive maker’s standard control program firmware manual, 3AXD50000016097 Rev H, 2022-02-28, Undervoltage control (power loss ride-through): if the incoming supply voltage is cut off, the drive continues to operate on the kinetic energy of the rotating motor. Numeric DC undervoltage limits not asserted. https://library.e.abb.com/public/052c19b4002f45cf908d536363a39bb4/ASCD2216x_en.pdf
- A leading drive maker’s technical manual, parameter L2-01 Momentary Power Loss Operation Selection, setting 0 disabled: if power is not restored within 15 milliseconds, a Uv1 fault results. Parameter L2-02 recovery time default 5 seconds per a second manual from the same maker. Undervoltage voltage level in volts not asserted. https://www.manualslib.com/manual/346442/Yaskawa-A1000-Series.html?page=249
- Pacific Gas and Electric. Power Quality: Voltage Sag Ride-through Mitigation in Sequence by Increasing Cost, 2018-07 (several small adjustable speed drive models have user programmable automatic restart, typically waiting 30 to 60 seconds for the circuit to stabilize before restarting). https://www.pge.com/assets/pge/docs/contact-us/report-an-issue/Voltage_Sag_Ridethrough_Mitigation.pdf
- A leading drive maker’s comparison, Active front end drive versus passive filter, comparison of harmonic mitigation technology, LVD-EOTKN073U-EN Rev A, 2021-09-30 (six-pulse drive with no internal impedance about 80% current distortion measured at the lugs, as high as 120%, AC line reactor or DC choke 35 to 50%, passive filter 5%, active front end 3 to 5%). Manufacturer typical values, not a measurement series. https://library.e.abb.com/public/5eb87f704cc14fa596fb610f5dfb27a3/LVD-EOTKN073U-EN%20_REVA.pdf
- A leading drive maker’s guide, Harmonics: A Guide to Supply Harmonics and Other Low-Frequency Disturbances, issue 2020-09 (only odd harmonics of the order n = kp ± 1, three-phase rectifier with no inductance 145% current distortion and 38% with 3% inductance). https://www.nidec-netherlands.nl/media/2926-engineering-documentatie-a-guide-to-supply-harmonics-andother-low-frequency-disturbances-iss6-0704-0002.pdf
- A leading maker’s softstarter handbook, 1SFC132060M0201, 2010-11 (direct on line start normally 6 to 8 times rated motor current, softstarter about 3 to 4 times rated current during the start, torque falling with the square of the voltage, 50% voltage giving about 25% torque) and the same maker’s softstarter installation and commissioning manual, 1SFC132081M0201 (start ramp time 1 to 120 seconds, default 10 seconds, current limit level 1.5 to 7.5 times Ie, default 4.0). Manufacturer documents in that maker’s online library under the document numbers given.
- NEMA. Motor Terminology and Electrical Performance Characteristics, NEMA Motor and Generator Guides library, undated (locked rotor current typically 600 to 700% of full load). https://www.nema.org/docs/default-source/motor-and-generator-guides-and-resources-library/6-electric-motor-terminology-and-performance-characteristics-v2.pdf?sfvrsn=62ad61a9_2
- Muñoz Tabora, J., de Lima Tostes, M. E., Ortiz de Matos, E., Mota Soares, T. and Bezerra, U. H. Voltage Harmonic Impacts on Electric Motors: A Comparison between IE2, IE3 and IE4 Induction Motor Classes. Energies 13(13), 3333 (2020). Introduction (temperature rise of induction motors due to harmonics approximately 4 to 6 degrees Celsius, citing the paper’s reference 36, a literature value). Open access. https://doi.org/10.3390/en13133333
- Zhang, J., Wang, J., Li, H., Zhang, Q., He, X., Meng, C., Huang, X., Fang, Y. and Wu, J. A Review of Reliability Assessment and Lifetime Prediction Methods for Electrical Machine Insulation Under Thermal Aging. Energies 18(3), 576 (2025). Introduction (a 10 degree Celsius rise corresponds to a 50% reduction in insulation lifetime). Open access. https://doi.org/10.3390/en18030576
- Arenas Sarmiento, J. J., Herazo Acevedo, J. H., Sousa Santos, V., Silva Ortega, J. I. and Candelo-Becerra, J. E. Energy evaluation of pumping systems in a clean water plant: A study case. Journal of Sustainable Development of Energy, Water and Environment Systems 11(4), 1110466 (2023). Abstract (the variable speed drives increased current harmonics by 10%), power quality section (predominance of the fifth, seventh and eleventh orders, the product of the six-pulse variable speed drive, current distortion 11.09% at the common connection point, power factor 0.846). The plant pumps cooling water at an industrial site in Colombia. Open access. https://doi.org/10.13044/j.sdewes.d11.0466
- Alawasa, K. M. and Al-Badi, A. H. Investigation and Analysis of the Power Quality in an Academic Institution’s Electrical Distribution System. Energies 17(16), 3998 (2024). Section 3.2.2 (UPS connection point, total demand distortion 11.95, 14.83 and 13.03% against a 12% limit) and section 3.3 (chilled water circulated by motor pumps recently upgraded with variable-speed drives). A campus study, not a pump station study. Open access. https://doi.org/10.3390/en17163998
- Tsalas, N., Golfinopoulos, S. K., Samios, S., Katsouras, G. and Peroulis, K. Optimization of Energy Consumption in a Wastewater Treatment Plant: An Overview. Energies 17(12), 2808 (2024). Section 4 (aeration of the biological tank alone nearly 60% of total energy consumption in conventional activated sludge). Open access. https://doi.org/10.3390/en17122808
- Hamawand, I. Energy Consumption in Water/Wastewater Treatment Industry, Optimisation Potentials. Energies 16(5), 2433 (2023). The aerobic digestion system at 50 to 60% of required electricity, with sludge treatment 15 to 25% and recirculation pumping 15%, and electricity at about 20% of the cost of supplying and treating drinking water, mostly pumping. Open access. https://doi.org/10.3390/en16052433
- U.S. Environmental Protection Agency. Energy Efficiency in Water and Wastewater Facilities: A Guide to Developing and Implementing Greenhouse Gas Reduction Programs. Local Government Climate and Energy Strategy Series, 2013. Pages 1 to 2 (drinking water and wastewater systems at approximately 3 to 4% of U.S. energy use, 35% of typical municipal energy budgets, pumping the largest source of energy use before, during and after treatment, efficient pumping systems with variable frequency drives, Figure 1 listing on-site renewable energy among the options), page 4 (26 kilowatts per million gallons per day from digester biogas) and pages 11 to 12 (aeration about half of a wastewater plant’s energy use, biogas burned for electricity). Page numbers as printed. https://archive.epa.gov/epa/production/files/2015-08/documents/wastewater-guide.pdf
- U.S. Environmental Protection Agency. Evaluation of Energy Conservation Measures for Wastewater Treatment Facilities, EPA 832-R-10-005, 2010-09. Section 4.1 (aeration at 25 to as much as 60% of total plant energy use) and section 3.4 (capacitors at an induction motor as perhaps the most cost-effective correction of power factor, many utilities not charging small customers for poor power factor). https://www.epa.gov/sites/default/files/2016-01/documents/p1008sbm.pdf
- U.S. Environmental Protection Agency. Power Resilience Guide for Water and Wastewater Utilities, 2023-03. Pumping 55 to 90% of electricity use at a drinking water utility, pump failure leading to direct discharge of untreated sewage or backup into homes, page 3-11 (many generators failing after 24 to 48 hours during Hurricane Sandy for want of exercise and maintenance), page 6-8 (a 5 megawatt solar array with a 500 kilovolt-ampere battery and a microgrid powering a wastewater plant through extended outages), page 6-10 (a 30 megawatt microgrid supporting a water treatment plant in Houston), page 6-11 (a Rialto plant microgrid islanding for at least three days) and page 6-12 (a 3.2 megawatt cogeneration plant sustaining full plant operations). https://www.epa.gov/system/files/documents/2023-05/PowerResilienceGuide_2023_508c.pdf
- Great Lakes Upper Mississippi River Board of State and Provincial Public Health and Environmental Managers. Recommended Standards for Wastewater Facilities, 2014 edition, chapter 40, section 47.1 (the objective of emergency operation is to prevent the discharge of raw or partially treated wastewater and back-up into basements and property) and 47.2 (emergency pumping capability required unless on-system overflow prevention is provided by adequate storage, by connection to at least two independent utility substations, portable or in-place internal combustion engine equipment, or portable pumping equipment). A 2026 edition exists and its text is not free. https://extapps.dec.ny.gov/fs/projects/spdes/TenStateStrdsWastewater.pdf
- 40 CFR 122.41, Conditions applicable to all permits, current eCFR text. Paragraphs (l)(6) (twenty-four hour reporting of noncompliance which endangers health or the environment, written report within 5 days, unanticipated bypass and upset exceeding an effluent limitation), (m)(1)(i) (bypass defined as the intentional diversion of waste streams from any portion of a treatment facility), (m)(4)(i)(B) (the bypass defense not satisfied if adequate back-up equipment should have been installed in the exercise of reasonable engineering judgment) and (n)(1) (upset defined, excluding noncompliance caused by operational error, improperly designed or inadequate facilities, lack of preventive maintenance, or careless or improper operation). https://www.ecfr.gov/current/title-40/chapter-I/subchapter-D/part-122/subpart-C/section-122.41
- California Regional Water Quality Control Board, San Diego Region. Investigative Order R9-2011-0070, 2011-09-28 (a regional power outage on 2011-09-08 caused Pump Station 64 to not operate, a backup in the collection infrastructure, approximately 1.9 million gallons of untreated sewage to Los Peñasquitos Creek, Lagoon and the Pacific Ocean). https://www.waterboards.ca.gov/sandiego/water_issues/programs/enforcement/docs/2011/Sep/io_r9_2011_0070_los_pen_sso.pdf
- California Regional Water Quality Control Board, San Diego Region. Settlement Agreement and Stipulation for Entry of Administrative Civil Liability Order R9-2014-0008 (failure of the influent pump station uninterruptible power supply at the Hale Avenue Resource Recovery Facility, the influent pump ceased functioning, 180,700 gallons to Escondido Creek, San Elijo Lagoon and the Pacific Ocean, liability 133,927 dollars). https://www.waterboards.ca.gov/sandiego/water_issues/programs/compliance/docs/completed/2014/R9-2014-0008.pdf
- California Regional Water Quality Control Board, Los Angeles Region. Settlement Agreement and Stipulation for Entry of Administrative Civil Liability Order R4-2024-0149 (Long Beach Water Reclamation Plant, 2020-12-25: three electrical breakers tripped within the switchgear and cut power to the influent pump station, SCADA control and communication systems and phone systems, root cause a switchboard process logic controller backplane malfunction, 222,542 gallons to Los Cerritos Channel over about four and a half hours, liability 410,126 dollars). https://waterboards.ca.gov/losangeles/water_issues/programs/enforcement/acl_docs/2024/R4-2024-0149.pdf
- U.S. Environmental Protection Agency. Report to Congress on the Impacts and Control of CSOs and SSOs, 2004-08, chapter 4, page 4-26 and Figure 4.9 (of SSO events with a known cause in 25 states, 2001 to 2003: 48% blockages, 26% wet weather and infiltration, 11% mechanical or power failures combined, 10% line breaks). Power failures are not separated from mechanical failures. https://www.epa.gov/sites/default/files/2015-10/documents/csossortc2004_chapter04.pdf
- Georgia Power Company. Electric Service Tariff, Power and Light Medium, Schedule PLM-18, effective with bills rendered for the billing month of 2025-01 (where there is an indication of a power factor of less than 95% lagging the Company at its option installs metering to measure reactive demand, excess reactive demand is kVAR in excess of one third of the measured actual kW, billed at 0.42 dollars per excess kVAR). https://www.georgiapower.com/content/dam/georgia-power/pdfs/business-pdfs/tariffs/2025/plm-18.pdf
- Northern States Power Company, Minnesota (Xcel Energy). Minnesota Electric Rate Book, Section 5, General Service, Sheet 5-27, sheet effective 2017-10-01, in the current rate book (adjusted demand for billing determined by dividing the maximum actual demand in kW by the power factor but not more than 90% and multiplying by 90%, power factor metered for three-phase services above 200 amperes or above 480 volts). https://www.xcelenergy.com/staticfiles/xe/Regulatory/Regulatory%20PDFs/rates/MN/Me_Section_5.pdf
- ISO 8528-5:2025, Reciprocating internal combustion engine driven alternating current generating sets, Part 5: Generating sets (performance classes G1 to G4, voltage and frequency recovery times of several seconds after a load step). Edition 6, 2025-05, superseding the 2022 edition. Class G2 values of minus 10% transient frequency deviation and minus 20% transient voltage deviation on a load increase, with 5 and 6 second recovery, as reproduced in a leading generator maker’s Bulletin 5544421, Transient Performance of Generating Sets, 2019-03. https://www.iso.org/standard/85960.html and https://mart.cummins.com/imagelibrary/data/assetfiles/0058629.pdf
- IEC 61000-4-30:2025, Electromagnetic compatibility (EMC), Part 4-30: Testing and measurement techniques, Power quality measurement methods, edition 4.0 (class A basic measurement interval of 10 cycles at 50 hertz or 12 cycles at 60 hertz, dip and swell detection on half-cycle RMS). https://webstore.iec.ch/en/publication/71611
- IEEE Std 1459-2025, IEEE Standard Definitions for the Measurement of Electric Power Quantities Under Sinusoidal, Nonsinusoidal, Balanced, or Unbalanced Conditions (apparent, active and reactive power, displacement and total power factor under distortion, RMS current squared equals fundamental current squared plus harmonic current squared, with fundamental active and reactive components in quadrature). Supersedes IEEE Std 1459-2010, clause unchanged in substance. https://standards.ieee.org/ieee/1459/7578/
- Zielinski, D., Stefanczak, B. and Jedrys, K. Phase-Independent Reactive Power Compensation Based on Four-Wire Power Converter in the Presence of Angular Asymmetry between Voltage Vectors. Energies 15(2), 497 (2022). Voltage asymmetry and phase-angle shift from single-phase and converter loads growing worse where short-circuit impedance is high, per-phase reactive compensation. Open access. https://doi.org/10.3390/en15020497
- Shi, W., Bai, C. and Wang, Z. Power distribution system blackstart restoration using renewable energy. Nature Communications 17, 8498 (2026). Water and wastewater treatment plants named among critical loads energized first under limited supply, industrial demand with induction motors of tighter voltage tolerance and sizable starting currents, cold load pickup as a brief inrush from transformer remagnetization and motor starting with substantial reactive demand forcing inverters into current limiting, uneven phase loading creating localized voltage violations, protection failure modes most acute on long high-impedance laterals. https://doi.org/10.1038/s41467-026-76692-0
- Tuladhar, L. R. and Banerjee, K. Impact of the Penetration of Inverter-Based Systems on Grid Protection. CIGRE US National Committee, 2019 Grid of the Future Symposium (inverter fault current 1.1 to 1.5 times rated output current). https://cigre-usnc.org/wp-content/uploads/2019/10/2D_3.pdf
- Keller, J. and Kroposki, B. Understanding Fault Characteristics of Inverter-Based Distributed Energy Resources. NREL/TP-550-46698, National Renewable Energy Laboratory, 2010-01 (synchronous machines deliver about six times rated current for several cycles). https://www.nrel.gov/docs/fy10osti/46698.pdf
- 3DFS. VectorQ Technical Overview, Installation and Application Notes, current revision (VectorQ2 208 volt, three-phase with neutral, up to 60 kW, 9 kVAR, 50 A per phase. VectorQ5 480 volt, three-phase with neutral, up to 120 kW, 60 kVAR, 60 A per phase. No rating above 480 volts, custom voltages on request. Neutral and ground must be connected. Voltage tolerance plus or minus 15%, frequency tolerance plus or minus 0.5%. Sensing under 10 nanoseconds, correction under 5 microseconds. Harmonic measurement to the 53rd order and correction to the 23rd. Neutral current reduced to near zero by active phase balancing, phase load balancing within 20% of average. 1,000 or more samples per sine wave. Typical consumption under 600 W. Heat dissipation under 2.4 kW and under 3.6 kW at full load. Connection by a three-line, neutral and ground cable in parallel to the network through a dedicated breaker, current transformers on the incoming phase conductors rated to 200 A per phase with custom ratings on request. Multiple units in parallel with no master and no inter-unit communication, each unit measuring and correcting the conditions at its own connection point. A unit corrects to its rated output and the remainder passes uncorrected. Overload behavior current-limited. Correction stated to begin immediately, and a diagnostic of about three minutes at power-on. A second capacitor bank or active filter on an existing installation requires re-engineering the coordination. Not compatible with RCD or GFCI devices. Touch current 3.5 mA AC. CE conformity assessment per IEC 62477-1, UL compliance by field evaluation. Indoor, IP20, minus 5 to plus 42 degrees Celsius, 85% humidity, 1,000 m altitude, EMC Class A, no hazardous-location rating stated. The electrical system continues to operate as before if the controller is removed or powered down). Product document. First-party.
- 3DFS. SDE Technical Training Document (response-time comparison: SDE under 100 microseconds, active harmonic filter 1 to 10 milliseconds, capacitor banks 1 to 3 seconds, automatic voltage regulator 1 to 10 seconds. Correction current equals the negative of the harmonic, reactive and imbalance components). Internal document. First-party.
- 3DFS. Products page (VectorQ2 and VectorQ5 in production, VectorQ2 detects 120 to 240 volts with one, two or three phases with or without neutral and ground, parallel connection at the panel, outside the current path, installation without interrupting the circuit, each controller measures the current under correction, live record of power quality at the panel, pilot starts with an on-site network analysis against the facility’s baseline), SDE Summary page (the controller logs each correction), Resilience page (no internet dependency and no cloud latency) and Press and Case Studies page (the water treatment facility performance study under Studies and analyses, the trial results and caveats). 3DFS website. First-party. /products, /technology/sde-summary, /technology/resilience and /press-proof
- Intelligent Building Solutions. Report for Power Conditioning VectorQ2, performance study for a VectorQ2 prototype in a water treatment facility (third-party instrumented study with a calibrated power quality analyzer and a second analyzer as backup. Plant loads: motors on starters or variable frequency drives, high service pump drives of 75 to 150 horsepower behind line reactors, blowers, transfer pumps, a 1,200 ampere automatic transfer switch and standby generator. MCC-D, 480 volt: average voltage 456.7, 447.3 and 456.7 volts phase to phase in the first snapshot and 466.7, 458.2 and 466.7 volts over the 2 hour 39 minute trend, the narrative’s average power factor of about 0.72 with a range of 0.22 to 0.83, the trend table’s power factor columns of interval minimum and maximum values averaging 0.62 and 0.82, 32 voltage dips, voltage distortion between 7 and 10% in the harmonic snapshot table. General receptacle panel, 120/208 volt three-phase fed from a 45 kVA transformer, about 10 amperes per phase: average power factor 0.83, 0.84 and 0.85 with the unit off and 0.95 and 0.96 with the unit on. Last-day pair: unit on, 9.3, 7.0 and 8.3 amperes and 2.7 amperes neutral, power factor 0.955. Unit off, 9.4, 2.2 and 6.6 amperes and 2.9 amperes neutral, power factor 0.85. No active power reading in the narrative for the panel pair. The prototype required an internet connection for reporting). Customer withheld. Listed on Press and Case Studies as Water treatment facility performance study.
- 3DFS. SDE Power Quality Correction Test Results, refrigerated container, analyzer data sheet, Test 4 rows (refrigerated container on 460 volts, 60 hertz, VectorQ5 in parallel on the 480 volt panel, analyzer at the panel with the controller inside the measurement. Correction off: 6,992 W, 4,852 var, 8,511 VA, power factor 0.82, average current 9.93 A, average current distortion 4.96%. Correction on: 7,066 W, 488 var, 7,083 VA, power factor 1.00, average current 8.25 A, current distortion 4.21%. Controller on with correction off, container running: 6,987 W. Controller powered off with the container running: 6,724 W. The differences between rows imply a controller draw of 263 to 342 W). Unpublished bench test. First-party.
- UK Ministry of Defence. Sanctuary Awards 2020, Highly Commended, Energy, Low Carbon and Resource Efficiency: The Defence Innovation Software Defined Electricity Project, published 2021-03-16 (trials in 2020-02 at the 3DFS facility in North Carolina, funded by the Defence Innovation Unit, with Underwriters Laboratories as independent third party. The entry states the technology had not been industrially deployed at any scale and names the MOD as the only external organisation to have tested the technology). GOV.UK. Bench setup from the trial report: three-phase test motor, three-phase brake motor, variable frequency drive, 70 and 150 microfarad capacitors, heater and single-phase motor on a 208 volt panel. Existence and setup only. https://www.gov.uk/government/publications/mods-sanctuary-awards-winners-2020/full-list-of-the-sanctuary-award-winners-2020
- Army Technology, 2021-04-01, reprint of the Brite Innovation Review interview with Lt Cdr Jonathan Parker, UK MOD Defence Innovation Unit (correcting at the last load does not propagate back up the network). https://www.army-technology.com/features/current-challenges-how-ai-enabled-power-distribution-could-prevent-losses/
- 3DFS. The Capacity Already in the Wires: Grid Reliability in the Fast Timescales, Technical Companion, section 8 (SDE is not a UPS and not a generator, satisfies no reliability standard on its own, and no U.S. national laboratory has characterized the figures). First-party. Listed on the Press and Case Studies page.
- IEEE Std 3002.7-2018, IEEE Recommended Practice for Conducting Motor-Starting Studies and Analysis of Industrial and Commercial Power Systems, and IEEE Std 3002.8-2018, IEEE Recommended Practice for Conducting Harmonic Studies and Analysis of Industrial and Commercial Power Systems. Active. Paywalled. Cited for the existence of the study practice. Numeric values not asserted. https://standards.ieee.org/standard/3002_7-2018.html and https://webstore.ansi.org/standards/IEEE/ieee30022018
- U.S. Environmental Protection Agency. Energy Efficiency for Water Utilities, web page updated 2026-05-20 (energy is 25 to 30 percent of a utility’s total operation and maintenance costs, and as much as 40 percent of operating costs for drinking water systems). https://www.epa.gov/sustainable-water-infrastructure/energy-efficiency-water-utilities
Version 3.0