The performance claims of 3DFS Technology have been met with some skepticism, so as a teaser, here is some data of a North Carolina 3 phase facility’s electrical network at the point in the time (05:45) when the Vector Q2 was turned into its correction mode. The data provided was gathered by a Tektronix PA4000 power analyzer – overseen and verified by a Tektronix senior field Engineer and shows the readings as the 3DFS device went to work. The data speaks for itself and will hopefully spark more skepticism due its mesmerizing content.
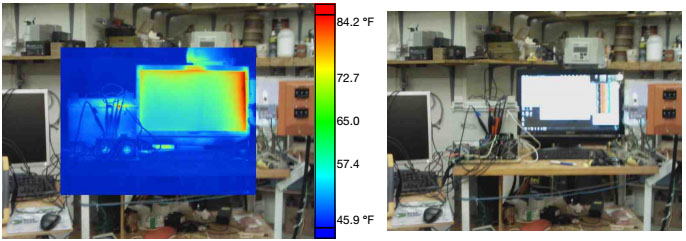
This is a thermal image of the Vector Q2 connected in parallel to the main breaker panel – obtained with Fluke Ti400.
Below are graphs from the data of the PA4000 power analyzer – captured on the 10th of February 2014 at 15:05:39
Root-Mean-Square Current
Root-Mean-Square Voltage
Watts
Power Factor

Volt-ampere
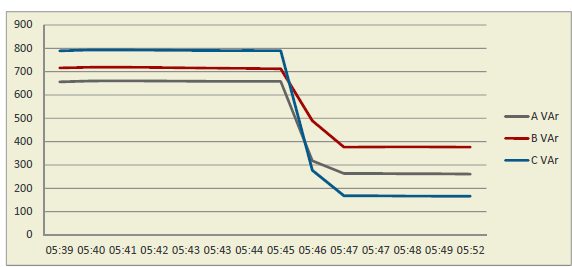
Volt-ampere Reactive
Download the PDF: PA4000-TestData
|